The report template setup tool is a function to add and configure report templates.
Important feature: When a report is created in RMS, the company name, user name and the user signature will all be added to the footer of the report together with the number of pages and RMS version number.
Print Screen 1 |
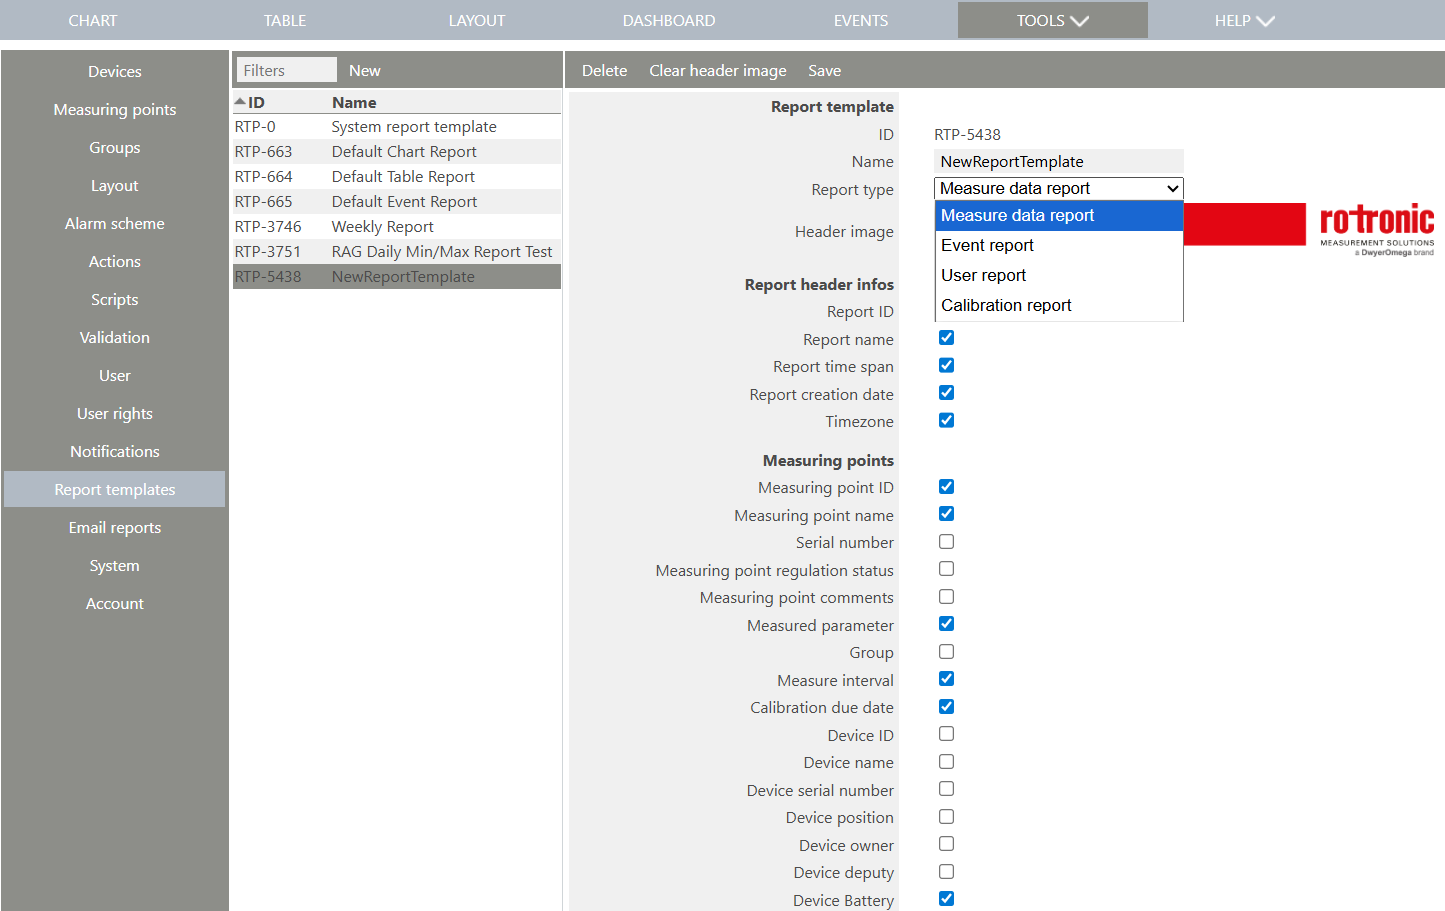
The user can select the report templates that are already setup: •System report template (cannot be adapted). •Default Chart Report (can be adapted). •Default Table Report (can be adapted). •Default Event Report (can be adapted).
Four report templates exist: •Measure data report: Used when exporting measurement values from the data analysis. •Event report: Used when exporting events from the audit trail. •User report: Used as template for email reports, it contains all user information. •Calibration report: Used to report calibration of single or groups of measurement points.
The user also has the possibility to add a new or delete a template, clear the header image or save the configuration.
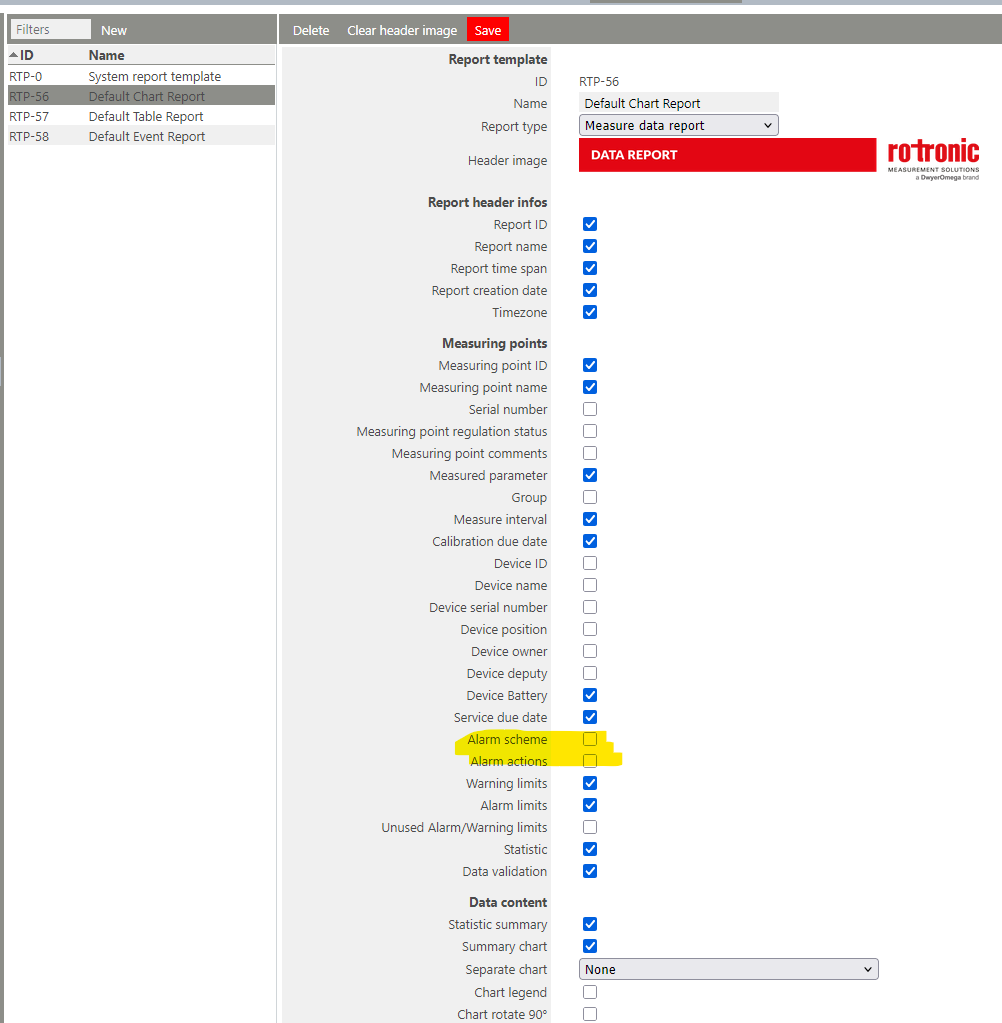
For a measure data report:
Report template: •Report ID: RTP-xxx automatically given by RMS. •Report Name: User configured report template name. •Report Type: User configured report type template name, either measure data report or event report. •Header image: User configured report template header.
For all the points below, the user must tick the box in order to see the values within the report.
Report header infos: •Report ID: DOC-xxx automatically given by RMS. •Report name: User configured report title name. •Report time span: User configured report time span (from/till). •Report creation date: User configured report creation date. •Timezone: Time zone of the user that created the report.
Measuring points: •Measuring point ID: MPT-xxx automatically given by RMS. •Measuring point name: User configured measuring point name. •Serial number: Measuring point serial number automatically given by the device. The user can however Add a Probe Inventory Number. •Measuring point regulation status: Measuring point user configured regulation status (free text). •Measuring point comments: Measuring point user configured comment (free text). •Measured parameter: Measuring point measured parameter. •Group: User configured measuring point group. A measuring point can belong to multiple groups. •Measure interval: User configured measuring point measurement interval. •Calibration due date: User configured calibration due date. •Device ID: DEV-xxx automatically given by RMS. •Device name: User configured device name. •Device serial number: Device serial number automatically given by the device. •Device position: User configured device position. •Device owner: User configured device owner. •Device battery: Device battery level automatically given by the device. •Warning limits: User defined measuring point warning limits. •Alarm limits: User defined measuring point alarm limits. •Unused Alarm/Warning limits: Shows when have defined alarm limits, but the limits are not active. •Statistic: Measuring point statistic values (amount of measurement values, minimum value, maximum value, average value, standard deviation, mean kinetic temperature, process capability: Cp and CpK). •Data validation: System confirmation that the data has not been falsified.
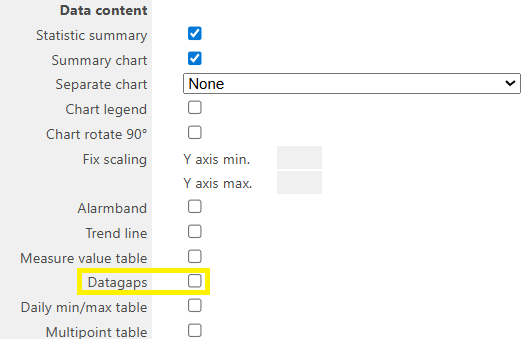
Data content: •Statistic summary: Statistic summary of all measurement points in the report (Not recommended when various parameters are used). oThe process capability (Cp and CpK) will not be included within the statistic summary. •Summary Chart: Include a summary chart. •Separate Chart: oNone: None separate charts are included. oBy measuring point: The charts are separated by measuring point. oBy parameter: The charts are separated by parameter. oBy display category: The charts are separated by display category. •Chart legend: Include a chart legend. •Chart rotate 90°: Rotate the chart to a vertical position. •Fix scaling: oY axis min: Define the minimum Y axis value. oY axis max: Define the maximum Y axis value. •Alarmband: Include the measuring point alarm bands in the chart. •Trend line: Include the trend line in the chart. •Measure value table: Include the measuring point table. •Daily min/max table: Include up to 4 daily min/max tables (including comment, date and signature fields).
Alarms: •Warnings summary: Show the total amount of warnings including minimum value, maximum value, minimum length, maximum length and total time. •Warnings details: Show each individual warning including minimum value, maximum value, minimum length, maximum length and total time. •Alarm summary: Show the total amount of alarms including minimum value, maximum value, minimum length, maximum length and total time. •Alarm details: Show each individual alarm including minimum value, maximum value, minimum length, maximum length and total time.
Limit violations: •Warnings summary: Show the total amount of warnings including minimum value, maximum value, minimum length, maximum length and total time. •Warnings details: Show each individual warning including minimum value, maximum value, minimum length, maximum length and total time. •Alarm summary: Show the total amount of alarms including minimum value, maximum value, minimum length, maximum length and total time. •Alarm details: Show each individual alarm including minimum value, maximum value, minimum length, maximum length and total time.
Related events: •Measuring point messages: Show all related measuring point messages. •Measuring point reminders: Show all related measuring point reminders. •Measuring points errors: Show all related measuring point errors. •Device messages: Show all related device messages. •Device reminders: Show all related device reminders. •Device errors: Show all related device errors. •System messages: Show all related system messages.
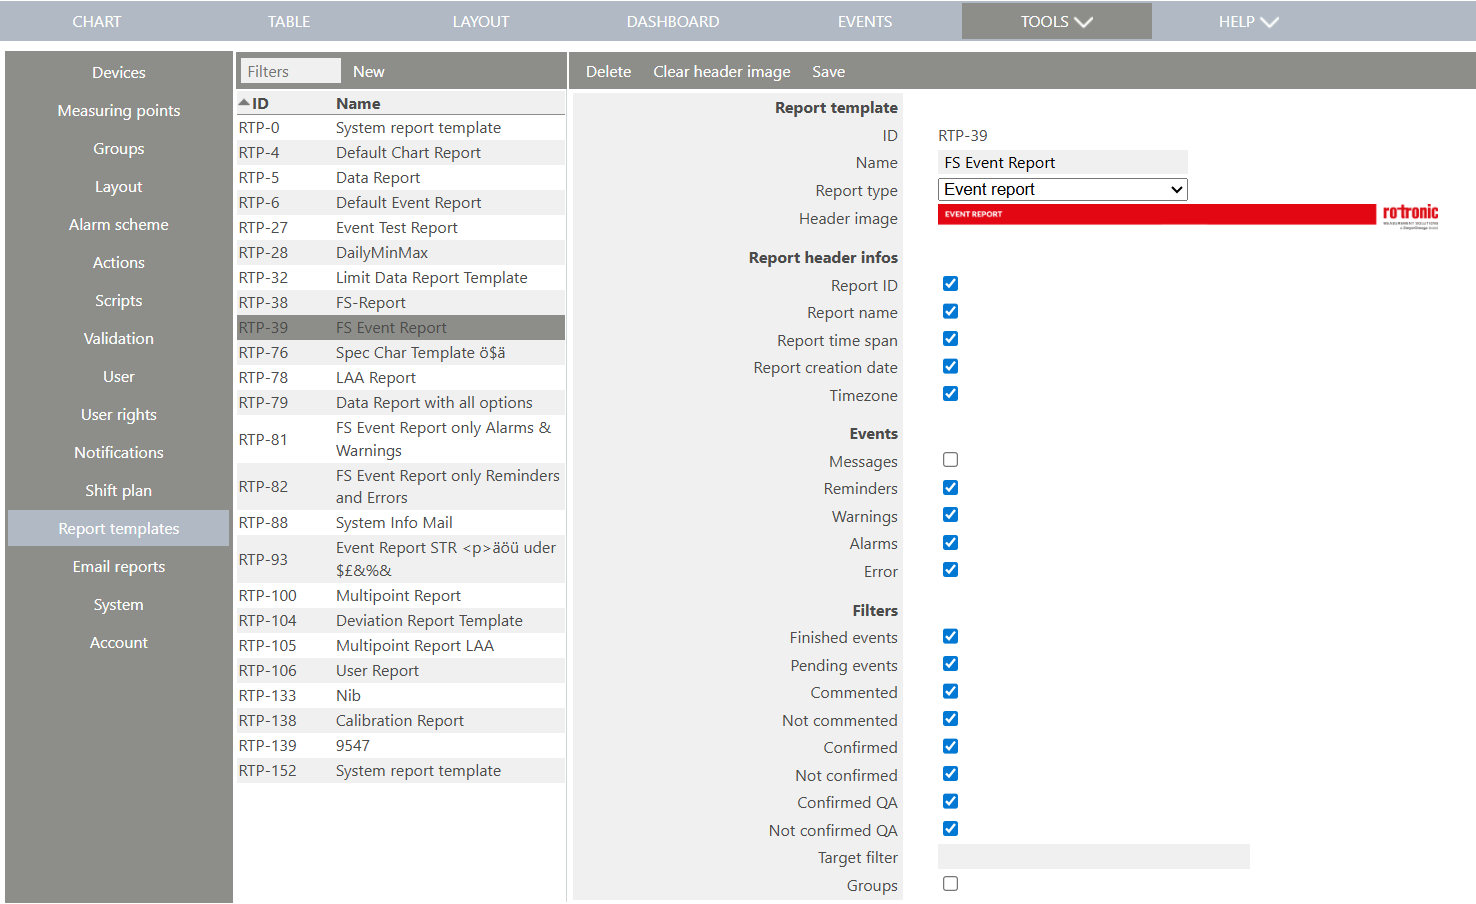
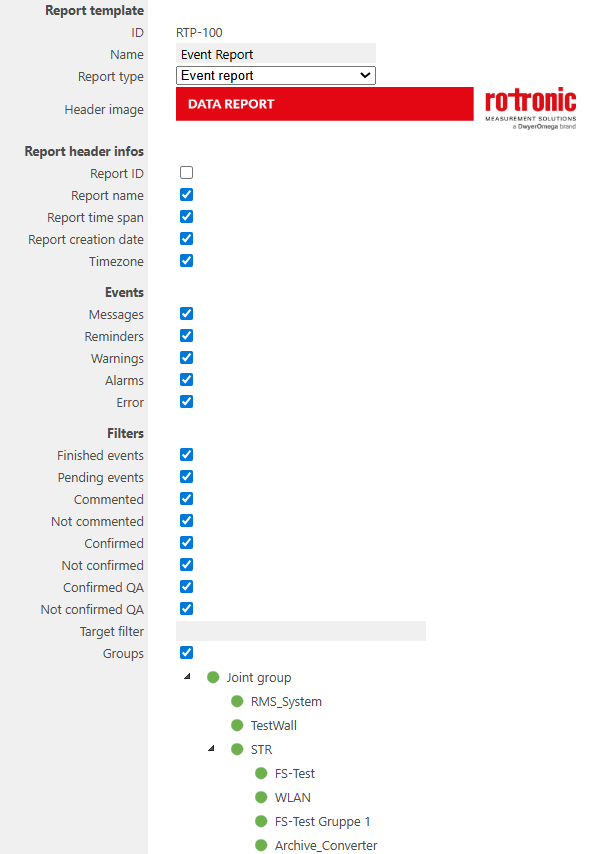
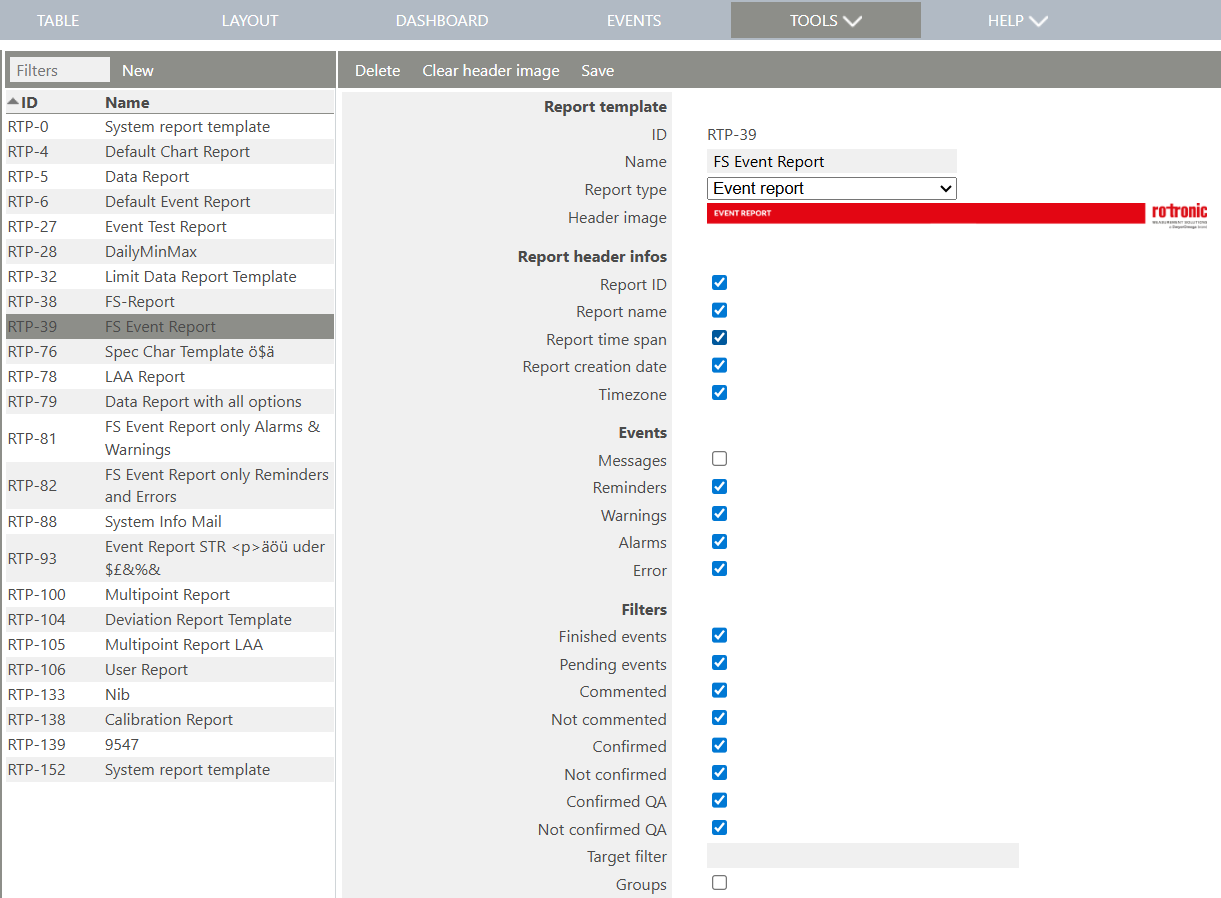
For an event report:
Report template. •ID: RTP-xxx automatically given by RMS. •Name: User configured report template name. •Report Type: User configured report type template name, either measure data report or event report. •Header image: User configured report template header.
For all the points below, the user must tick the box in order to see the values within the report.
Data content. •Messages: Show the messages. •Reminders: Show the reminders. •Warnings: Show the warnings. •Alarms: Show the alarms. •Errors: Show the errors. •Finished events: Show the finished events. •Confirmed: Show the confirmed events. |
|
Print Screen 2 |
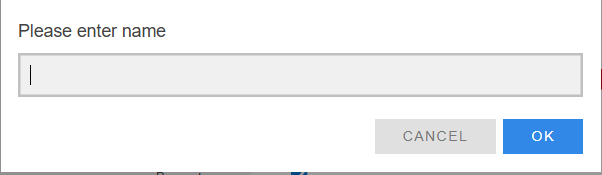
Add a new report template by clicking on new and entering a name.
|
|
Print Screen 3 |
The user has the possibility to configure the report template.
|
|
Update V2.8.0 |
Datagaps A new option "Datagaps" can be activated in this measure data report settings.
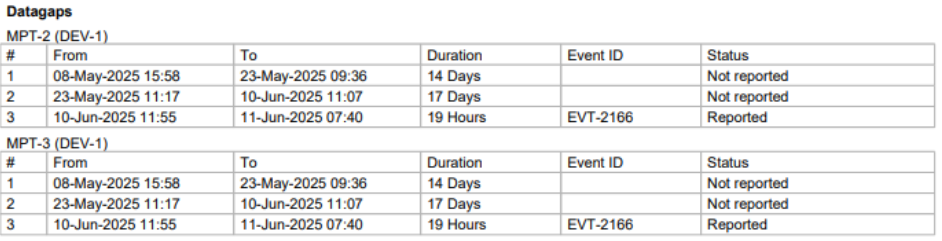
It adds a data analysis to the report. This analysis contain information about •Start and end time of data gaps •Duration •Event ID •Status. oDownload pending: A readout command is open. oReported: An open data gap reminder is available. oCommented: A commented data gap reminder is available. oConfirmed: A confirmed data gap reminder is available. oConfirmed QA: A confirmed QA data gap reminder is available. oDisabled: The device/measuring point was disabled during this time. oNot reported: An unexpected data gap occurred. oNo datagap: A data gap event is available, but the data is available.
Example within the report.
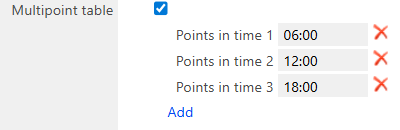
Multipoint table The Option "Multipoint table" creates a report with points of a defined time. This is often used in hospitals to create a report at several times during the day.
|
|
Update V2.8.0 |
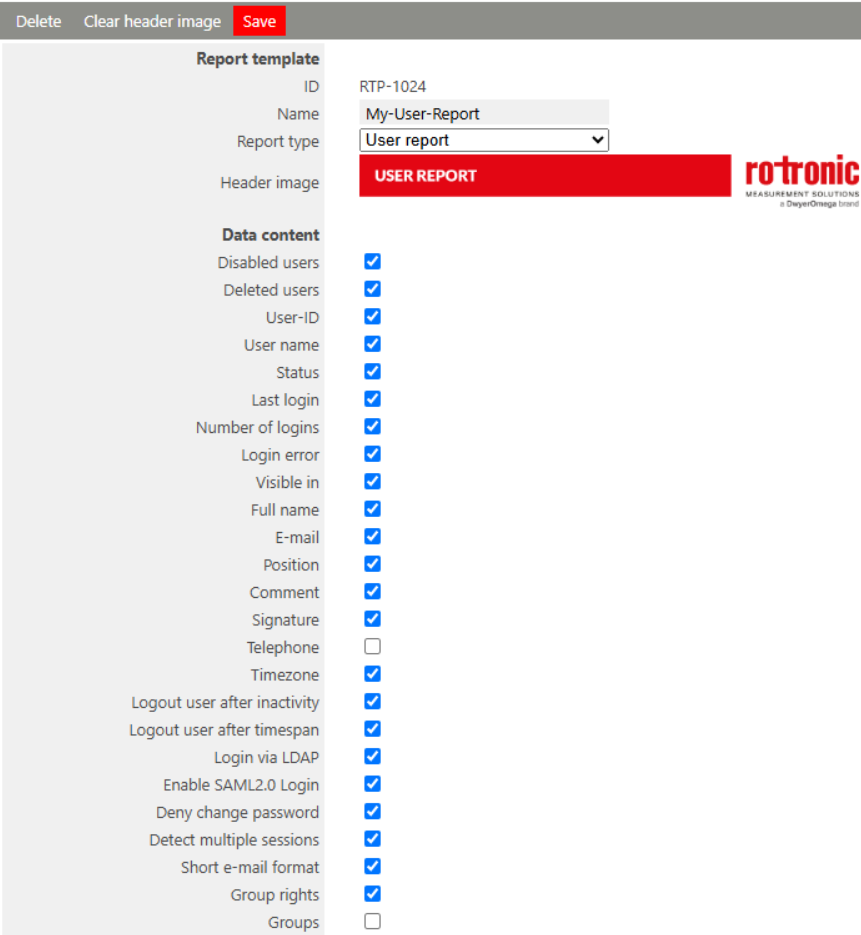
User report A new type of report is integrated
Filter by custom group The event report can be filtered by several options. A new option is the filtering by group - as follows:
•Setup - Report template: New Report Type "User Report" oSelection of disabled/deleted users oSelection of the group where the user are visible oSelection of each user setting separately to be visible or not •Setup - Email report: Selection of Group(s) and receiver(s) oAll users visible in the selected group (or in a child group) will be included in the report oAll user settings from the user setup are included in the report oReport is in PDF Format |
|
Update V2.8.0 |
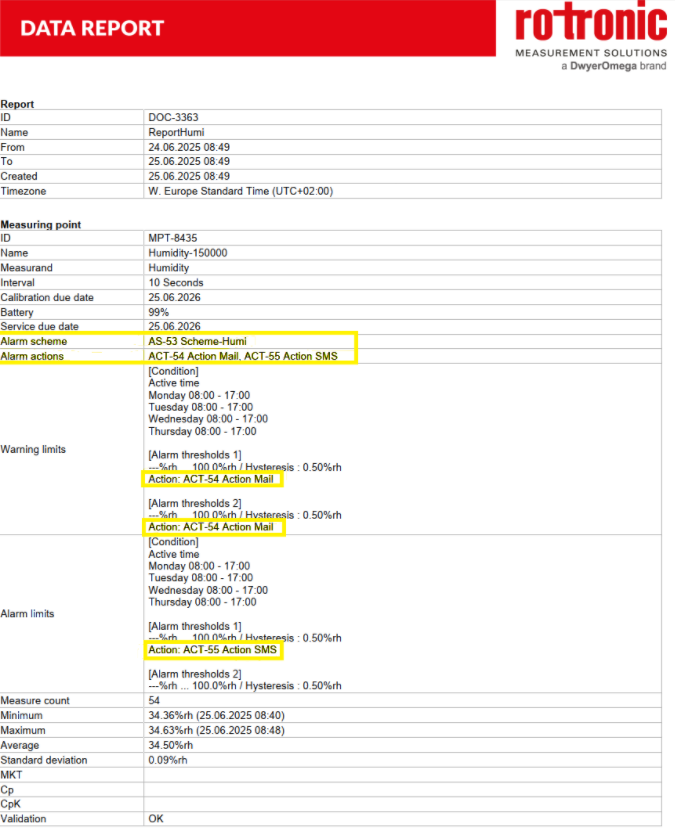
Alarm scheme AS and Alarm action ACT added to the report template The Measure data report template can be configured to add the Alarm scheme AS and Alarm action ACT.
Report example:
|
|
Update V2.9.0 |
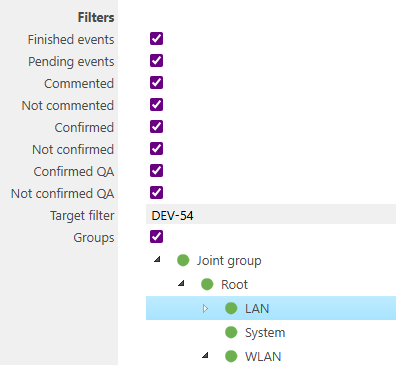
New feature - Target filter The event report template contains a new option, the Target filter, a free field where the user can enter measuring points, devices or groups as a filter function to simplify the report.
|
|
Update V2.9.1 |
When a user logs into RMS beeing in a different time zone then the RMS system time is, an User time zone is displayed additionally at Tools > Setup > Report templates: 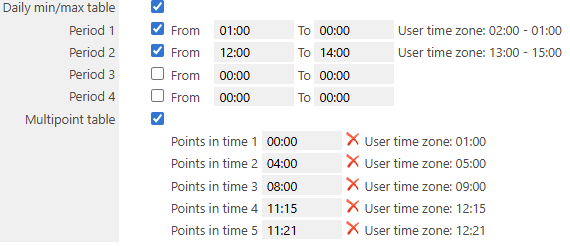
|
Updated: 20.05.2026