General
The tab logging controls data logger and handles log data. Logging can be started, stopped. Data can be download, analyzed, deleted and reports can be created.
Add / activate a data logger onto the device tree and the following page appears (example of an HL-1D).
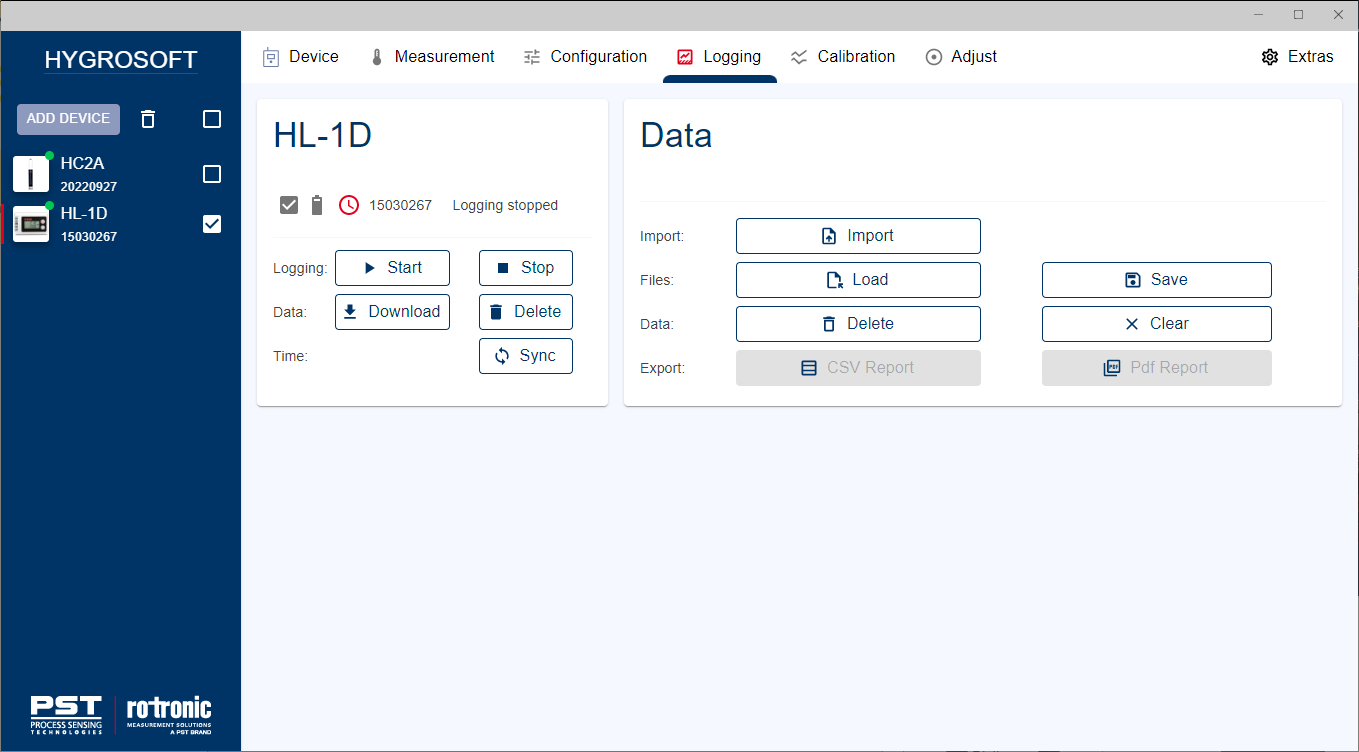
Device specific logging widget
The data logger-specific widget shows features and information that are supplied by the data logger directly.
This information can be the device identification (serial number), battery status, time sync. status, logging status etc. Those information are described in the sub-chapters of Supported devices.
•Start button - The logging can be initiated.
•Stop button - The logging can be stopped.
•Download button - The log data stored on the device will be downloaded for further logging function, e. g. data analysis or report. To keep the data permanent in the the App-internal database, the Save button must be used (see below - Data widget)
•Delete button - The log data stored on the device can be deleted from the device.
•Sync button - The time of the data logger is synchronized with the PC time.
For each data logger appears a Hygrosoft widget.
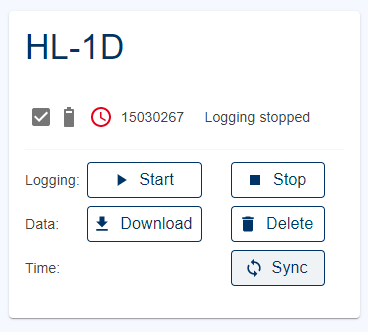
If various data logger of the same type are added, these loggers will be listed at the same widget
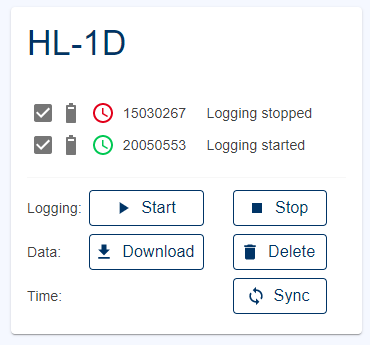
Several types of logger connected appears like this
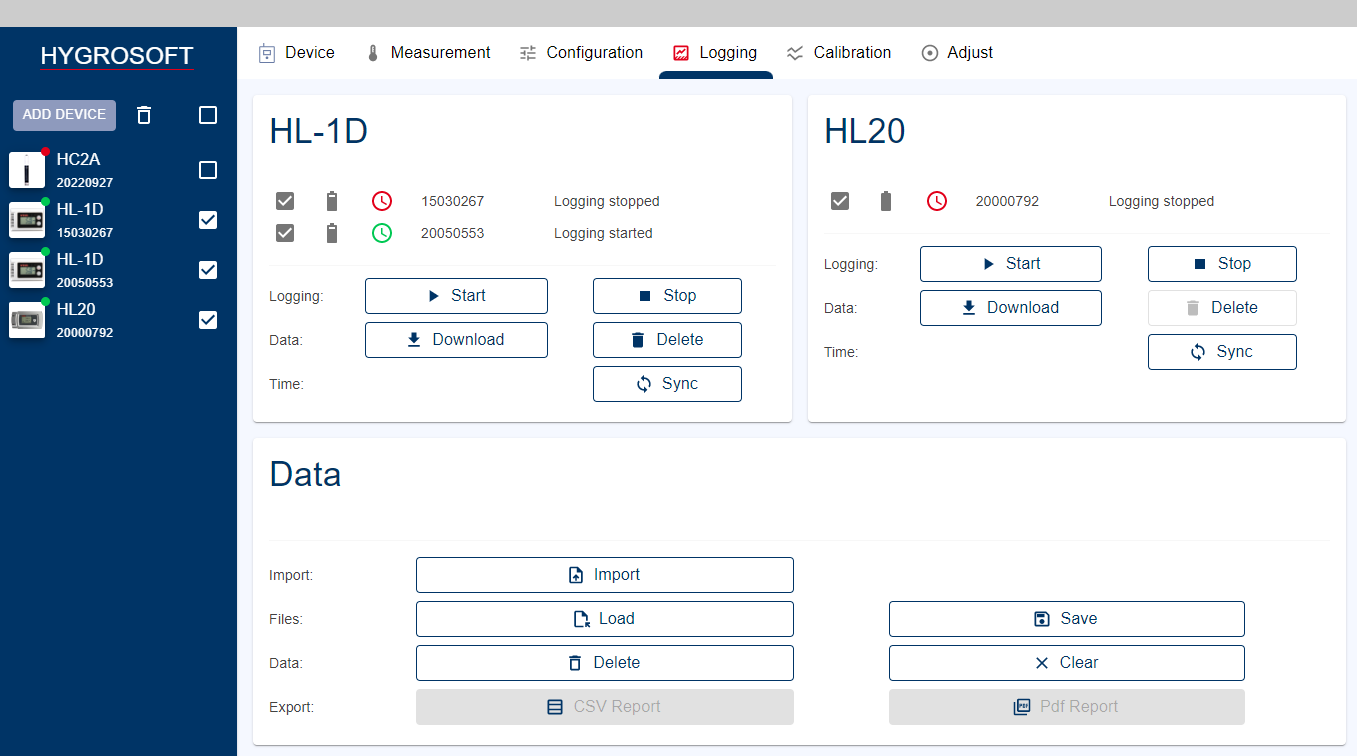
Data widget
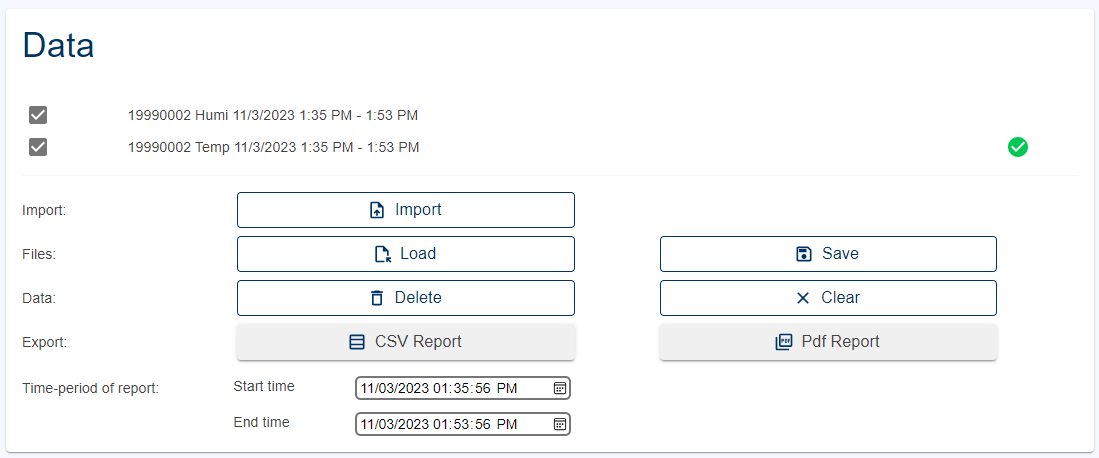
With this widget, the log data of several data logger can be handled, e. g. for comparison, analysis, export, import of log data stored in the data logger as well as in the database (previous log data e. g.).
•Import Button - Log data of the format *.xls and *.csv can be imported.
•Load Button - Log data of the App-internal database can be loaded for further action.
•Save Button - Available log data - downloaded from a data logger or imported from a file - can be saved into the App-internal database. The data will remain in the database and be available for late use.
•Delete Button - Log data in the database can be deleted.
•Clear Button - The data analysis (chart and statistics) are closed.
•TXT (CSV) Report Button - A TXT (CSV) report can be exported.
•PDF Report Button - A PDF report can be exported / printed.
•Excel Report Button - A Excel report can be exported.
•Red exclamation mark - one or more alarms happened.
•Time-period of report (Start time / End time input window) - The exact time period of the logged data for the CSV or PDF report can be defined here.
NOTE: The HygroSoft has an internal database that automatically stores all generated reports (PDF, CSV, etc.) locally. The local storage location can be found as follows: %UserProfile%\AppData\Local\Packages\Rotronic.Hygrosoft_<Paket-ID>\LocalState\Report
Data analysis
Available log data (from a data logger, from a data import or from the app-internal database) can be analyzed using a chart and statistics.
•Count - number of measurements
•Internval - measurement interval
•First item - time stamp of the first measured data
•Last item - tiem stamp of the last measured data
•Minimum - min. measured value
•Maximum - max. measured value
•Average - average of all measured values
•Std Deviation - standard deviation
•MKT - mean kinetic temperature
