The data analysis offers the possibility to extract data via .PDF, .csv or JSON reports.
Step 1 |
From the start page, click on Tools>Data Analysis: 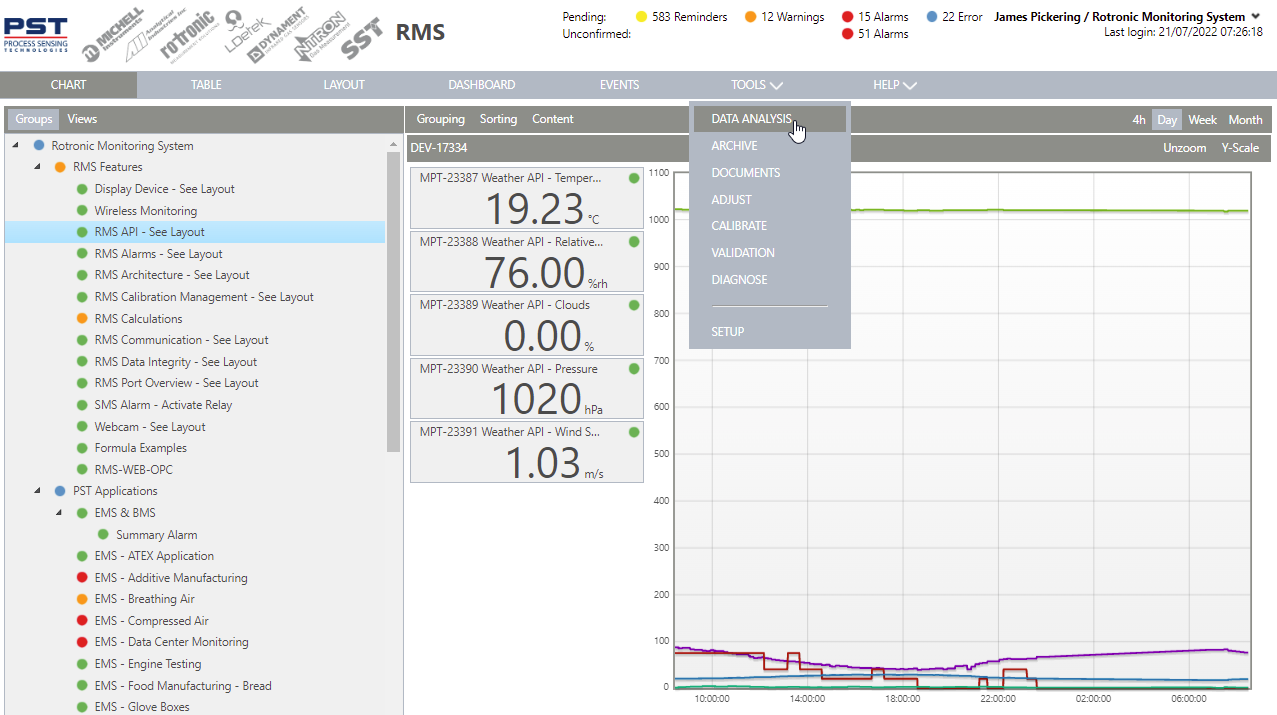 |
Step 2 |
Under navigation, select the required time frame, either via the predefined ranges or select the required range via the from/to function: 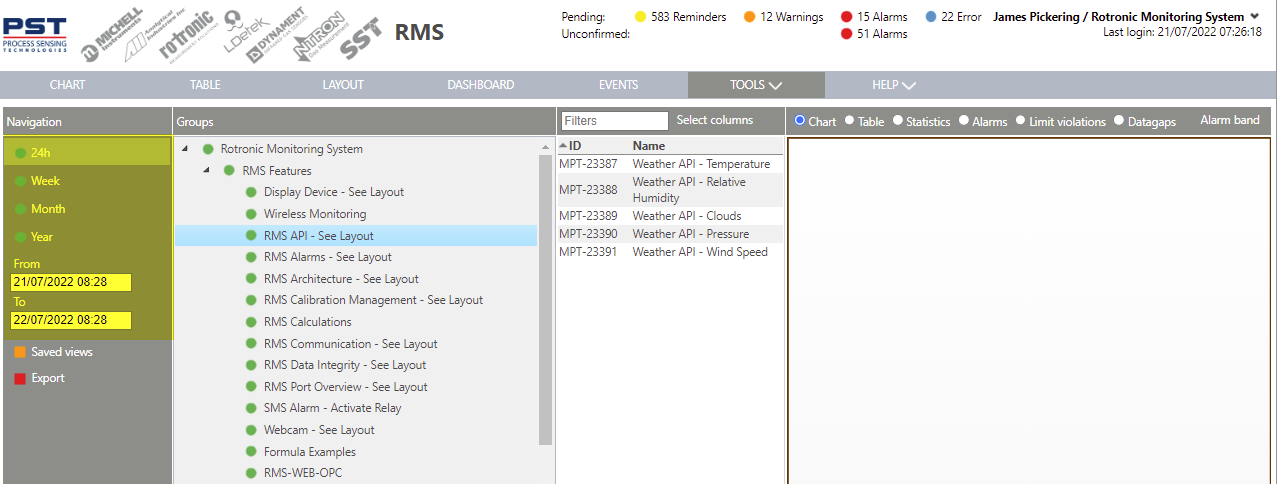 |
Step 3 |
Under groups, select the group where the measuring point(s) is/are located: 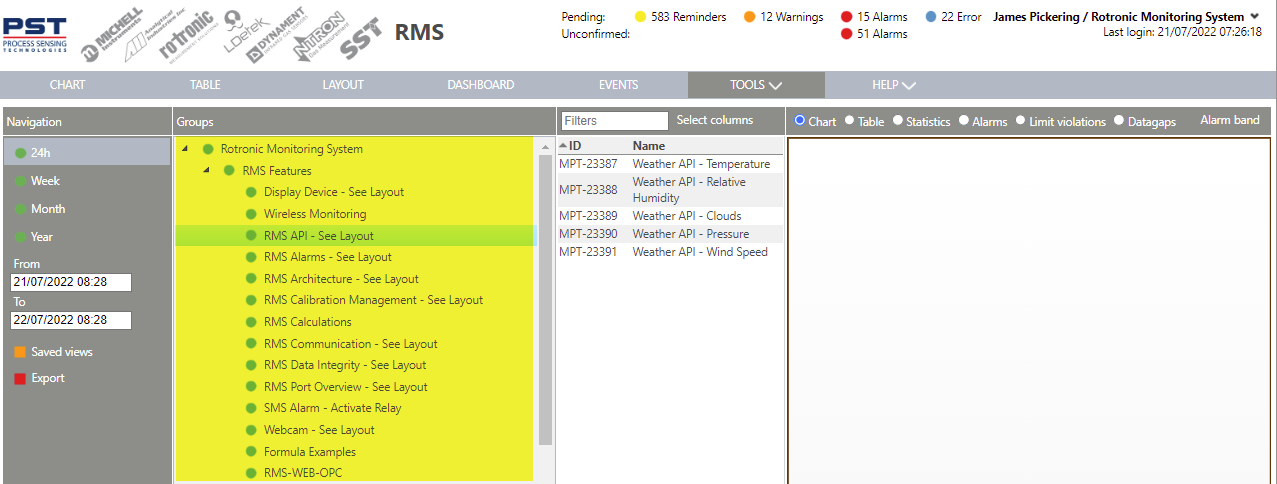 Under groups the user can select one or more groups (SHIFT or CONTROL). |
Step 4 |
Select the measuring point(s) required: 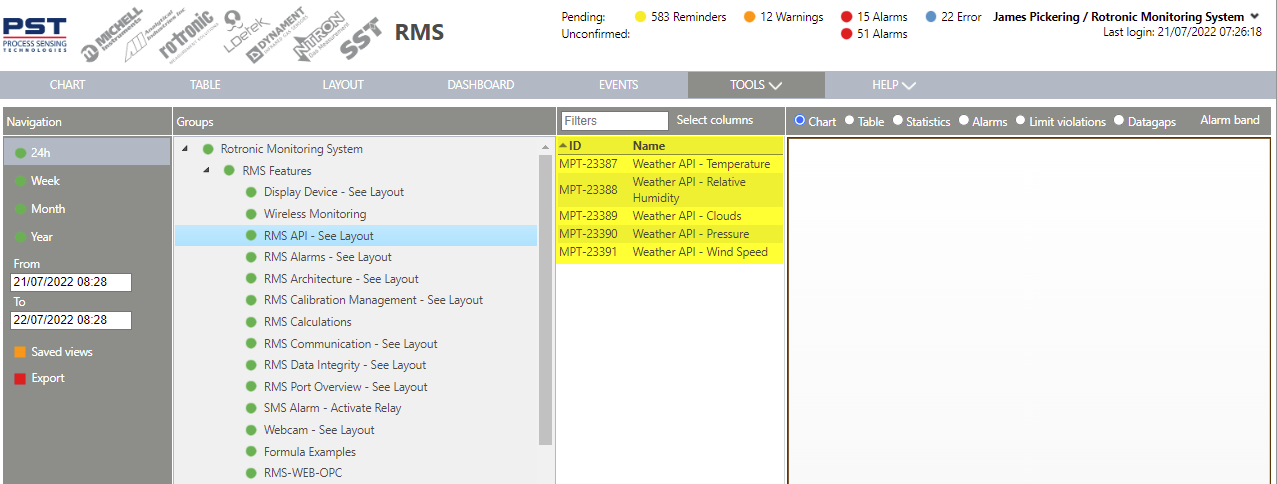 The user can then select one or more measuring points (SHIFT or CONTROL). |
Step 5 |
Once the require measuring point(s) selected, go to Export and select either CSV, PDF or JSON report: 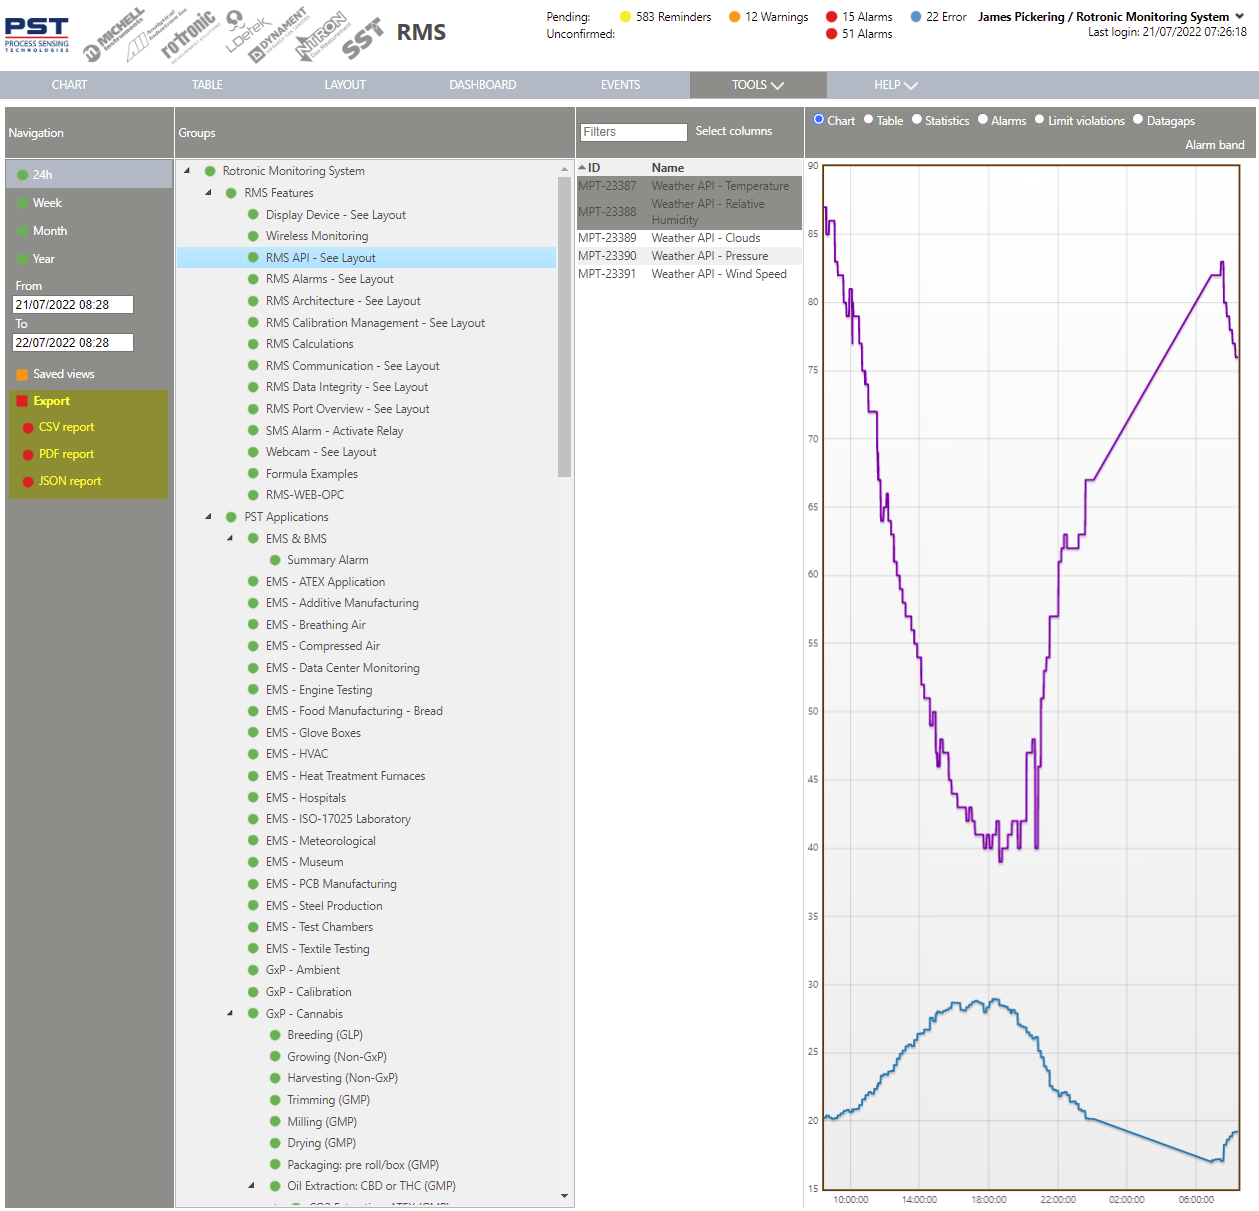 Once selected, the report will download/open. |
Step 6 |
Example of a CSV report: 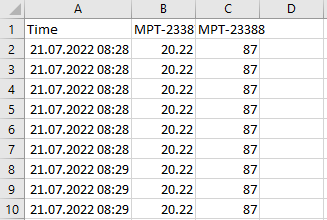 |
Step 7 |
When extracting via PDF: 1.Add a name for the report. 2.Select a template: Tools>Setup>Report Templates Explained. 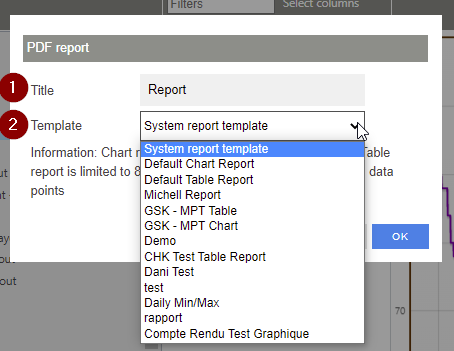 Click on OK to generate the PDF report. |
Step 8 |
Example of a PDF report: 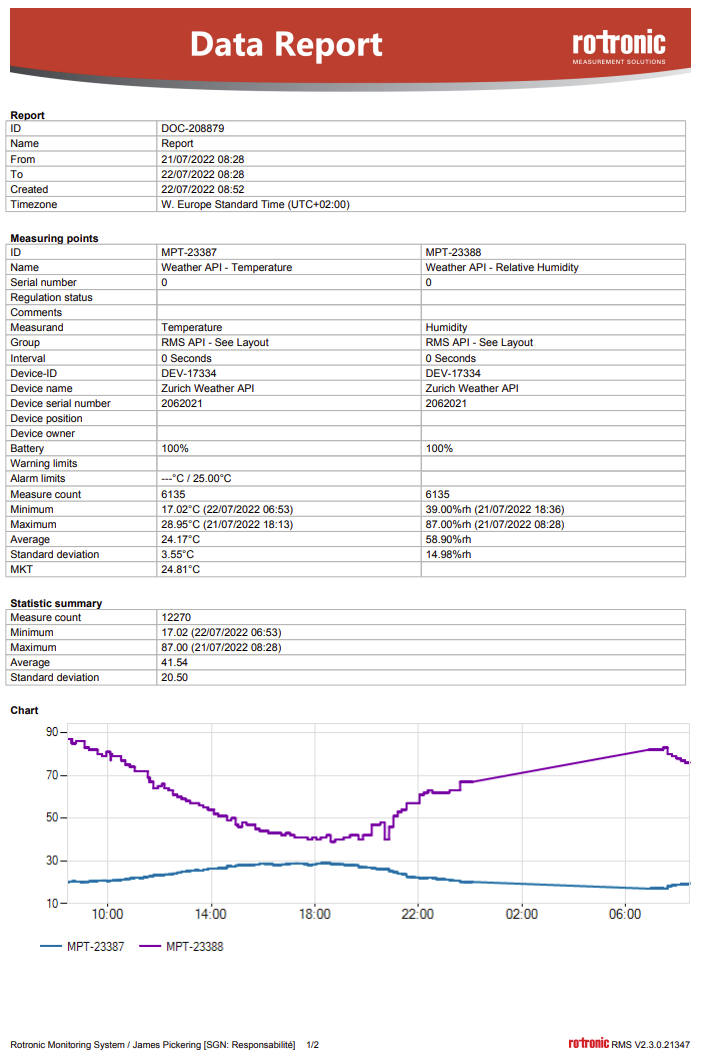 |
Step 9 |
When a PDF report is created, this will appear within the audit trail: 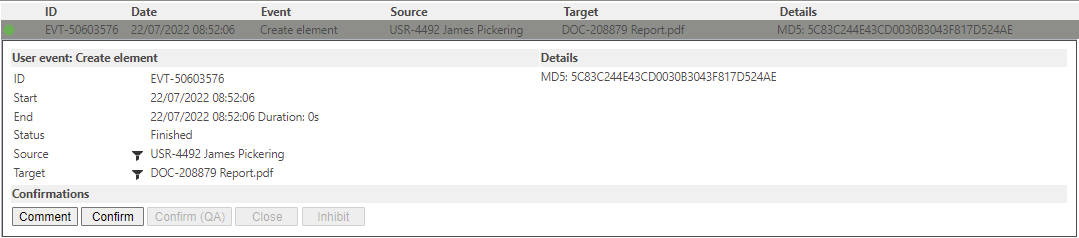 |
Step 10 |
The PDF is saved on the server and can be found under Tools>Documents: 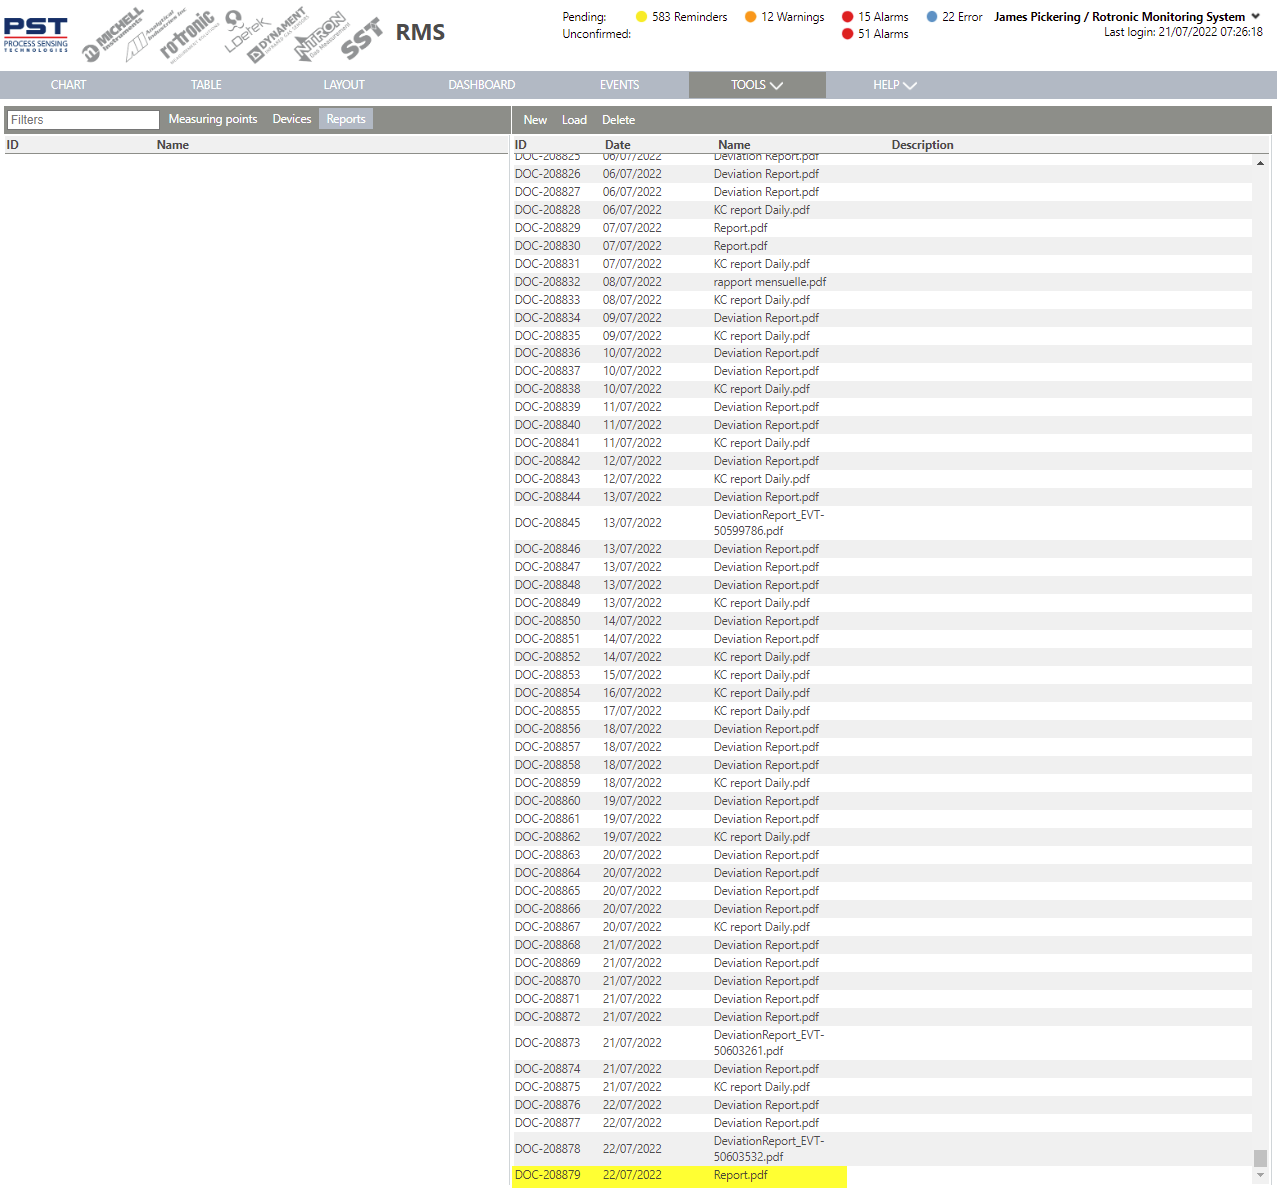 |
Step 11 |
Example of a JSON report, that will open in the browser: 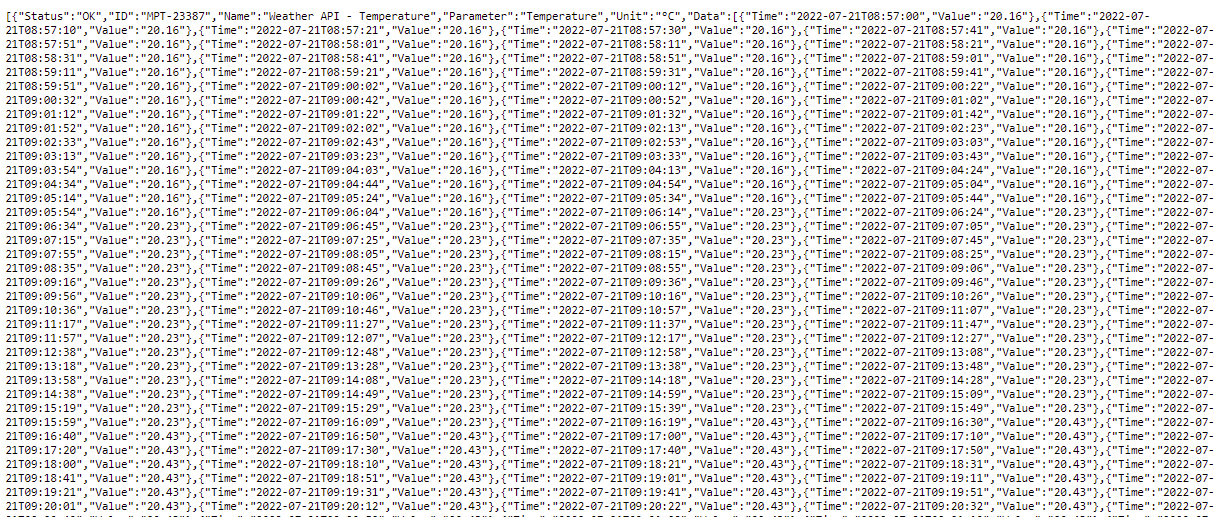 |