Every user can create up to 10 own dashboards. They can only be viewed by the respective user. All users manage their own "Dashboard" views themselves.
The dashboards can show all measuring points for which the user has read rights. The measuring points can be shown graphically and numerically. In addition to this, current alarms can be visualized as a table.
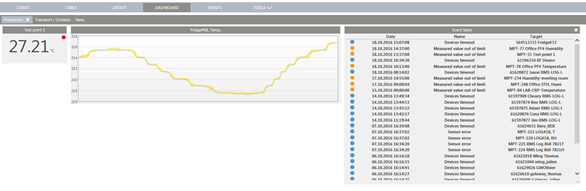
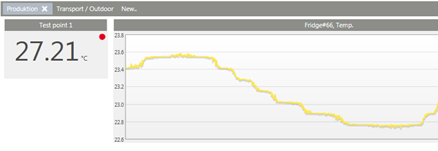
Figure 1: "Dashboard" view with table, graphic and numerical measuring points
New dashboards are created by clicking on "New..." (see Figure 1). New dashboard elements such as charts and numerical values are inserted by clicking the "Add widget" button (see Figure 2).
The widgets can be placed in the Dashboard by simple dragging. The size of the widget is changed by dragging at the bottom right corner.
 |
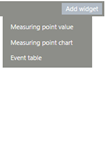 |
Figure 2: New dashboards are created or new dashboard elements added by clicking "New..." or "Add widget"