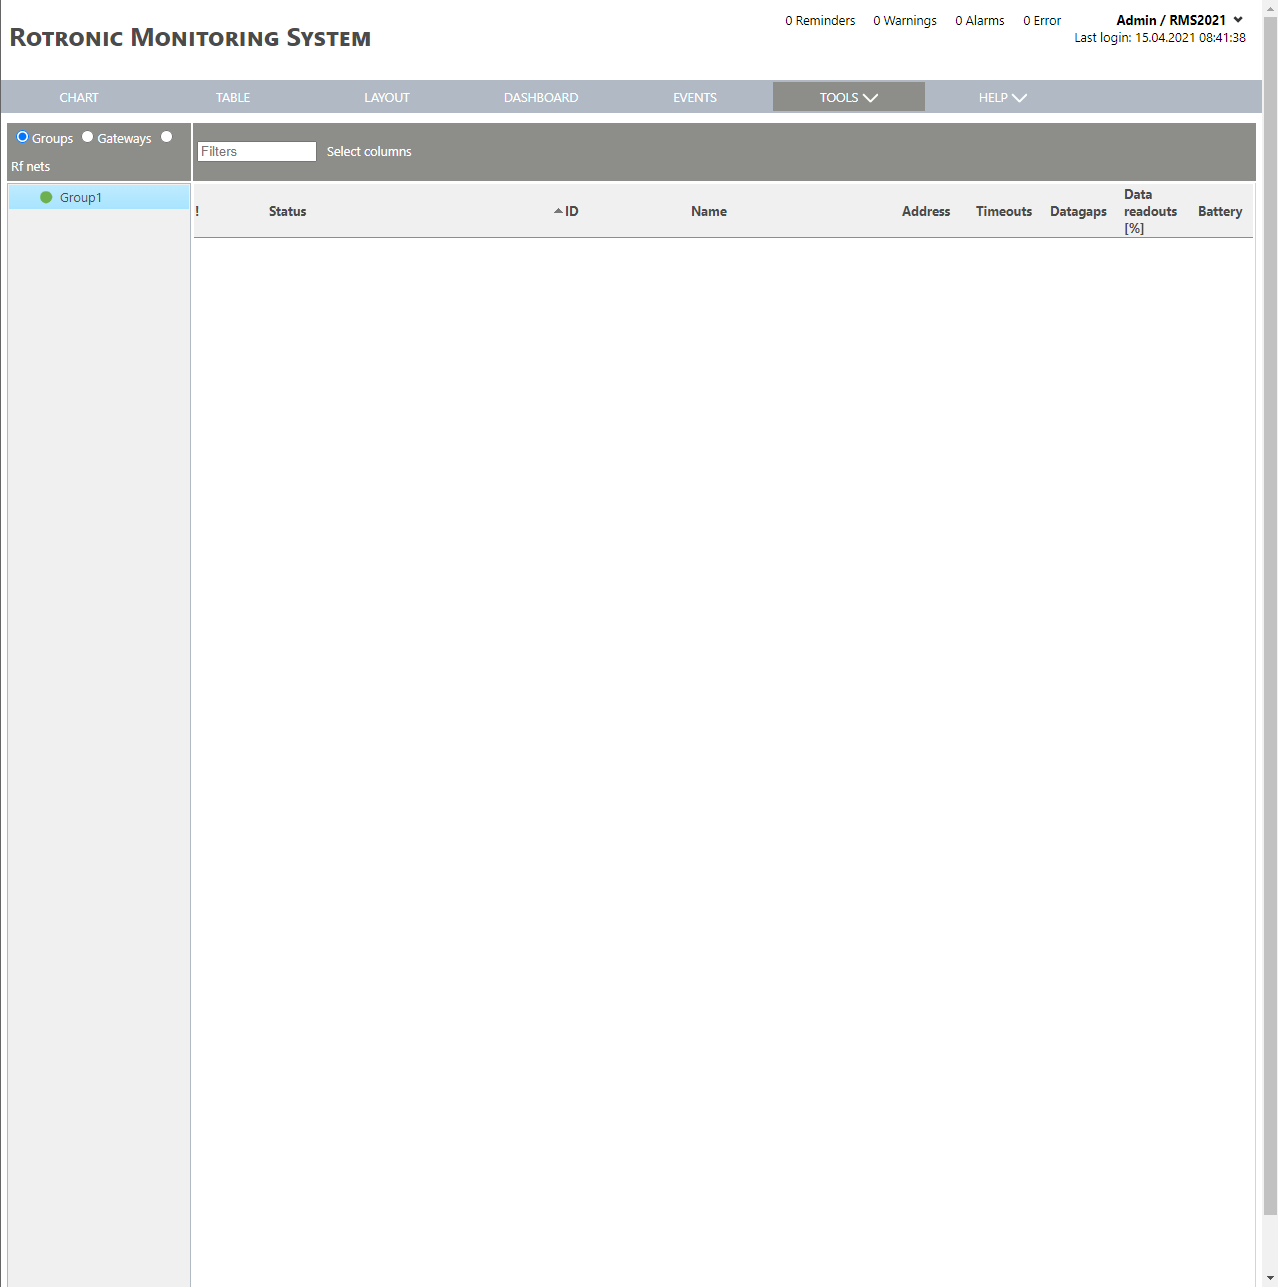
The diagnose tool is a function to quickly review the status of the wireless communication within the last 24 hours.
The diagnose tool is measuring the following parameters:
•Device timeouts.
•Data gaps.
•Read out commands.
•Battery level.
•Wireless network settings.
The following status' can exist:
Color |
Status |
Description |
|---|---|---|
Green |
OK (x%Data readouts) |
•No timeouts. •No data gaps. •<=1% read out commands. •No low battery. |
Yellow |
OK (x%Data readouts / Low battery) |
•No timeouts. •No data gaps. •1...10% read out commands. •Low battery. |
Orange |
Warning (x Timeouts / x Data readouts / Dublicate address / Low battery) |
•1 timeout. •No data gaps. •10...50% read out commands. •No low battery. •Wireless address duplicated. |
Red |
Alarm (x Timeouts / x Data readouts / x Datagaps / Dublicate address / Low battery) |
•>1 timeout. •>0 data gaps. •>50% read out commands. •No low battery. |
Blue |
Device offline |
The device is offline. |
Black |
Disabled |
The device is disabled. |
Important feature: whereas the color coding remains the same, the colors shown in the diagnose tool do not count towards the events from the audit trail.
Print Screen 1 |
The user can select what to review: •Groups: within the standard group structure, review a device status. •Gateways: all gateways are shown, review a device status that is connected to the specific gateway. •Rf nets: all network ID's are shown, review a device status that is within the specific network ID.  |
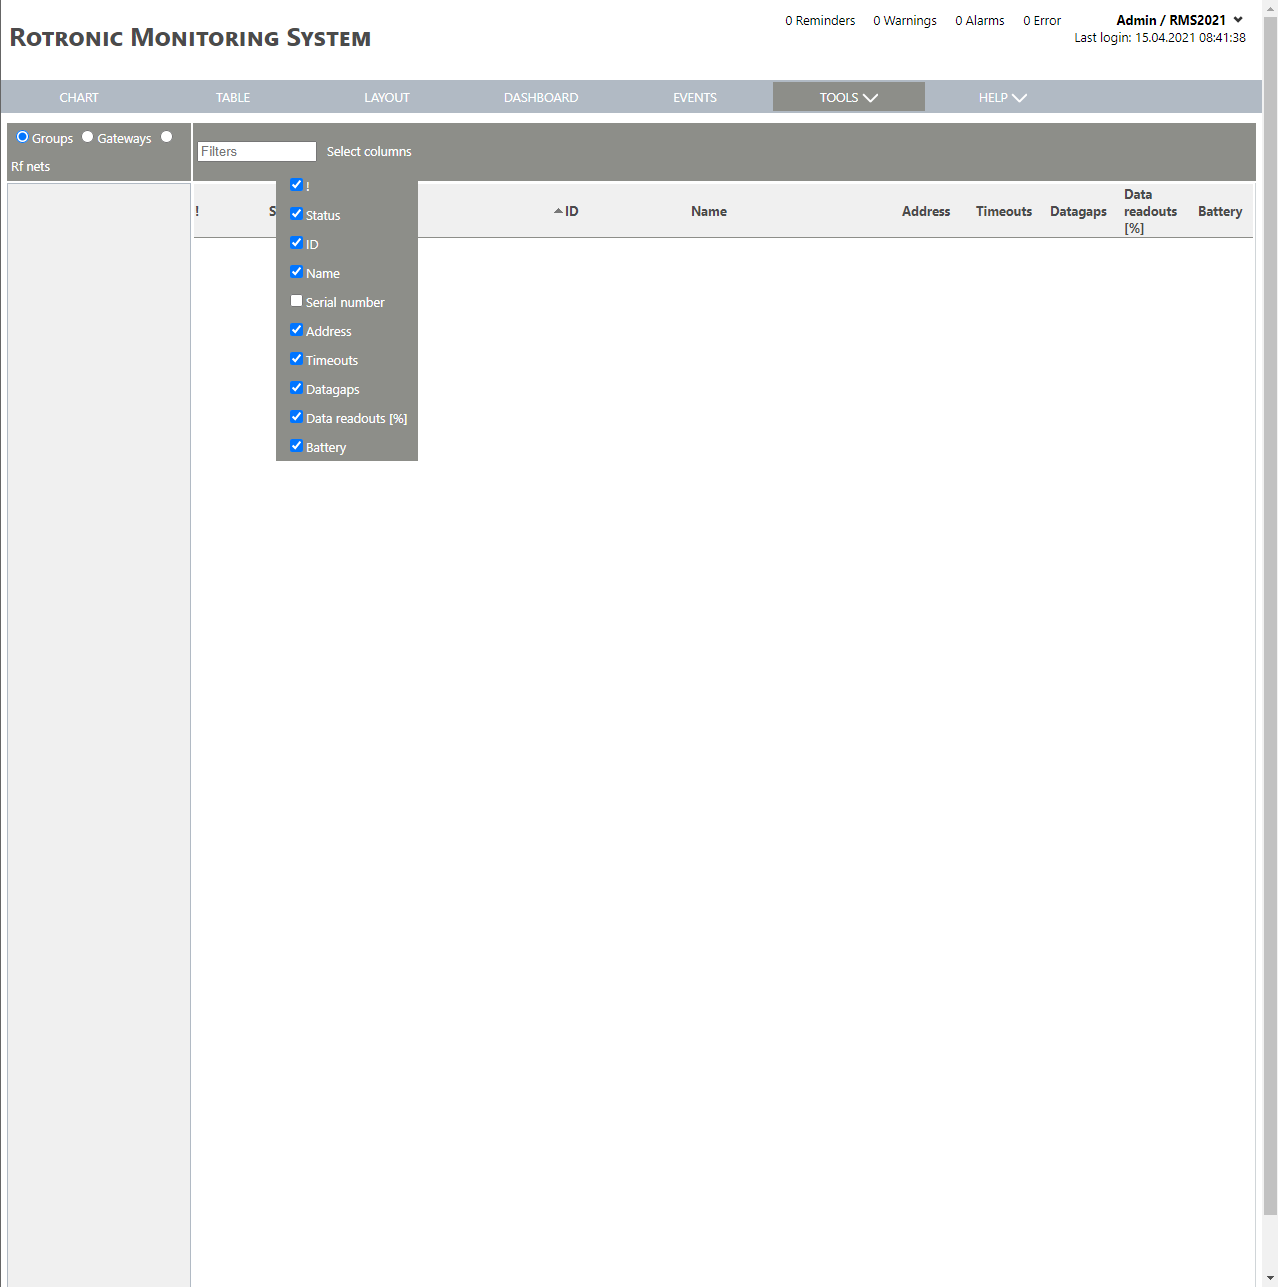
Print Screen 2 |
The columns shown in the device overview can also be selected.  |