All historical measurements of the system (except for archived data, see chapter 3.9) can be shown and evaluated in the data analysis.
It is possible to resize the various columns within the "Data analysis" view with the mouse (click and pull).
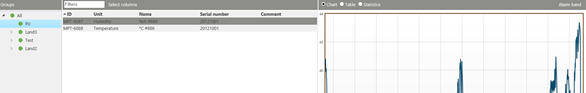
Figure 1: Overview of the complete data analysis function
The time frame for data display can be selected in the navigation column as follows:
Time Frame |
Description |
|---|---|
24h |
Last 24 hours |
Week |
Last 7 days |
Month |
Last month |
Year |
Last year |
From / To |
Free selection of start and end time point: day / month / year / time |
Within the data analysis overview, it is possible to select one or various groups (with "Shift" and "Ctrl"), then it is possible to select one or various measuring points (with "Shift" and "Ctrl").
Under the measuring points, it is then possible to select the following columns:
oID oUnit oName oSerial number oComment |
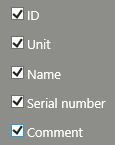 Figure 2: Possible column selections for measurement point details |
It is then possible to choose between three presentation variants:
Presentation |
Description |
|---|---|
Chart |
Graphic display with alarm bands and zoom functions |
Table |
oTime stamps of the measurement oMeasuring point oMeasured value |
Statistics |
oNumber of measuring points oMinimum value oMaximum value oAverage value |
Show Alarm Bands
The alarm and warning limits can be shown or hidden with the "Alarm band" menu at the right edge of the screen (Figure 3).
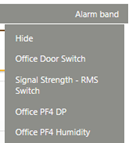
Figure 3: Alarm bands can be shown or hidden by measuring points
Save Views
The current display can be saved in the navigation menu "Saved views" > "Save as…". Earlier views can be called up again with the same menu item "Saved views".
Views that have already been saved can also be deleted (Figure 4).
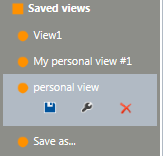
Figure 4: Save, edit or delete current view
Data Report
In the "Navigation" column, it is possible to export data being shown easily in the form of a finished report with the "CSV report" or "PDF report" functions.
oCSV report: numerical report as table
oPDF report: report with chart and statistical values. Maximum 8 measuring points and 20000 values are allowed in one PDF report.
Similar to the "Event" report, data can be exported using templates, which can be defined using "Tools" > "Setup" > "Report templates".
The generated PDF reports can be validated using "Events" > "Validate report".
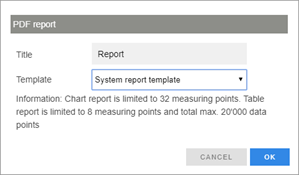
Figure 5: Selection window for generation of PDF report