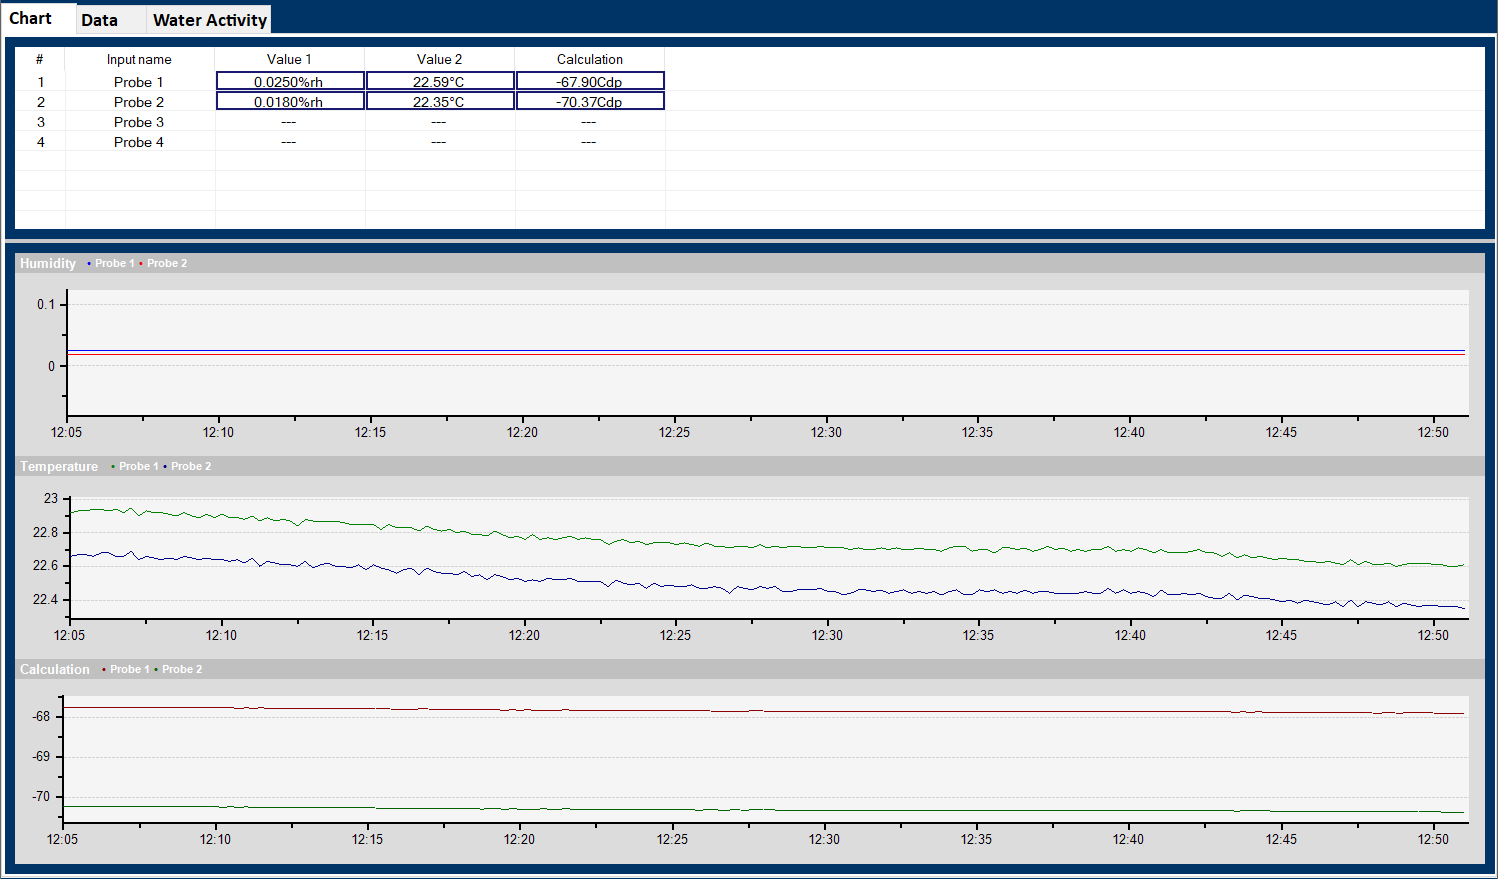
Chart
This tab displays measurement information in numerical and chart form.
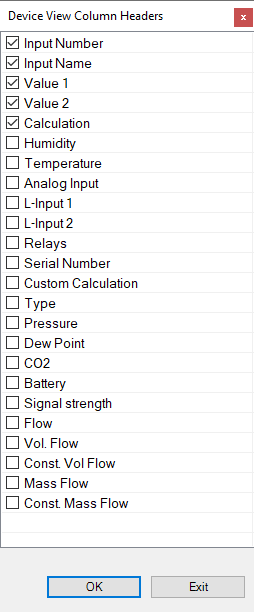
The columns can be chosen by the main menu (Settings and tools -> Column headers)
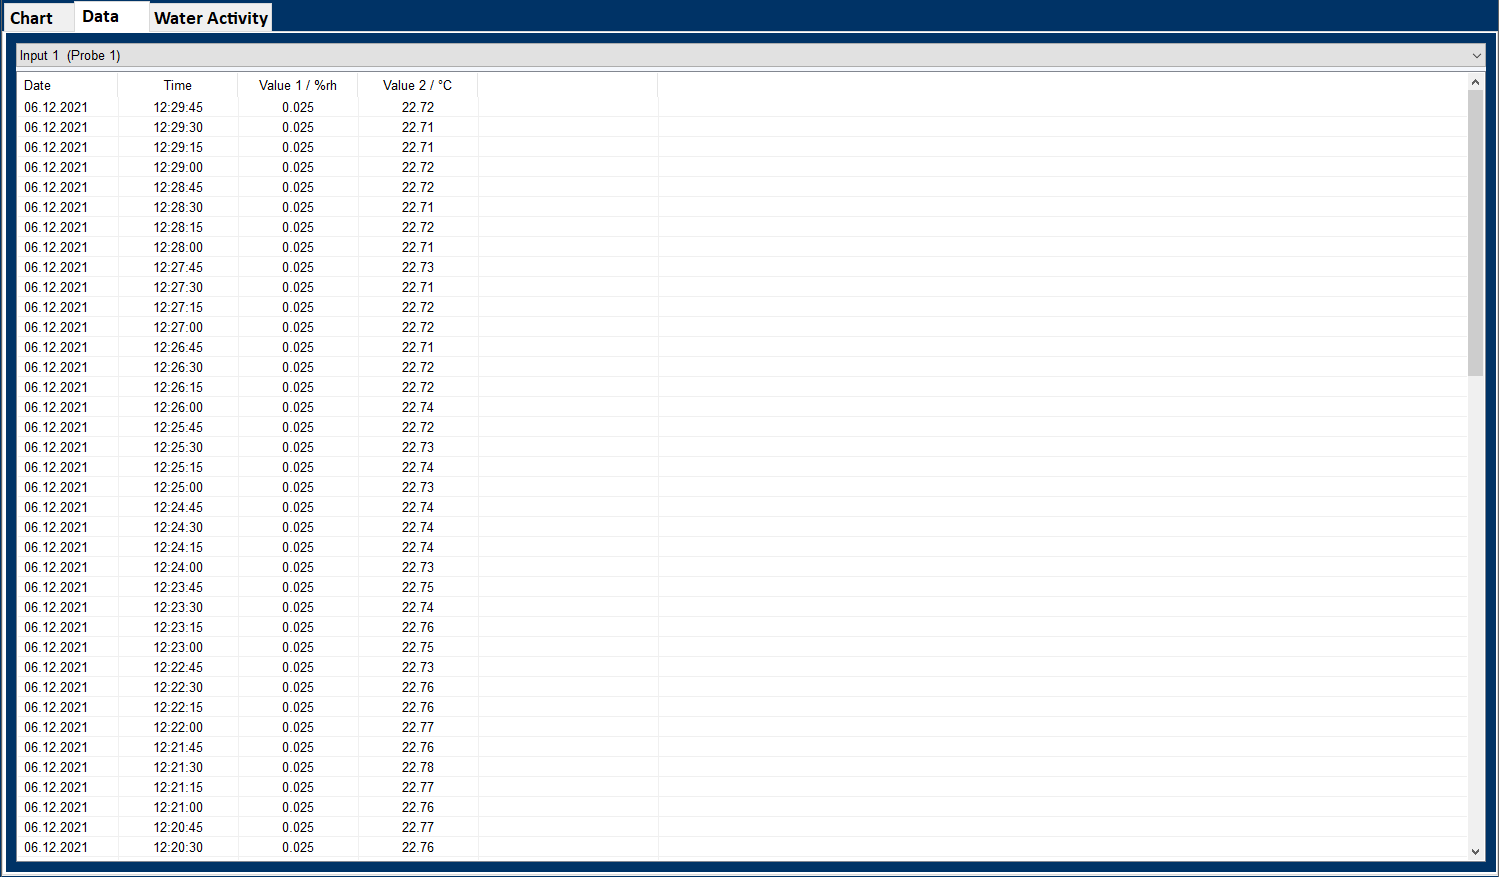
Data
This tabs shows the measurements with date, time stamp and numeric measurement value in table form. The probe can be chosen in the drop down menu (right side).
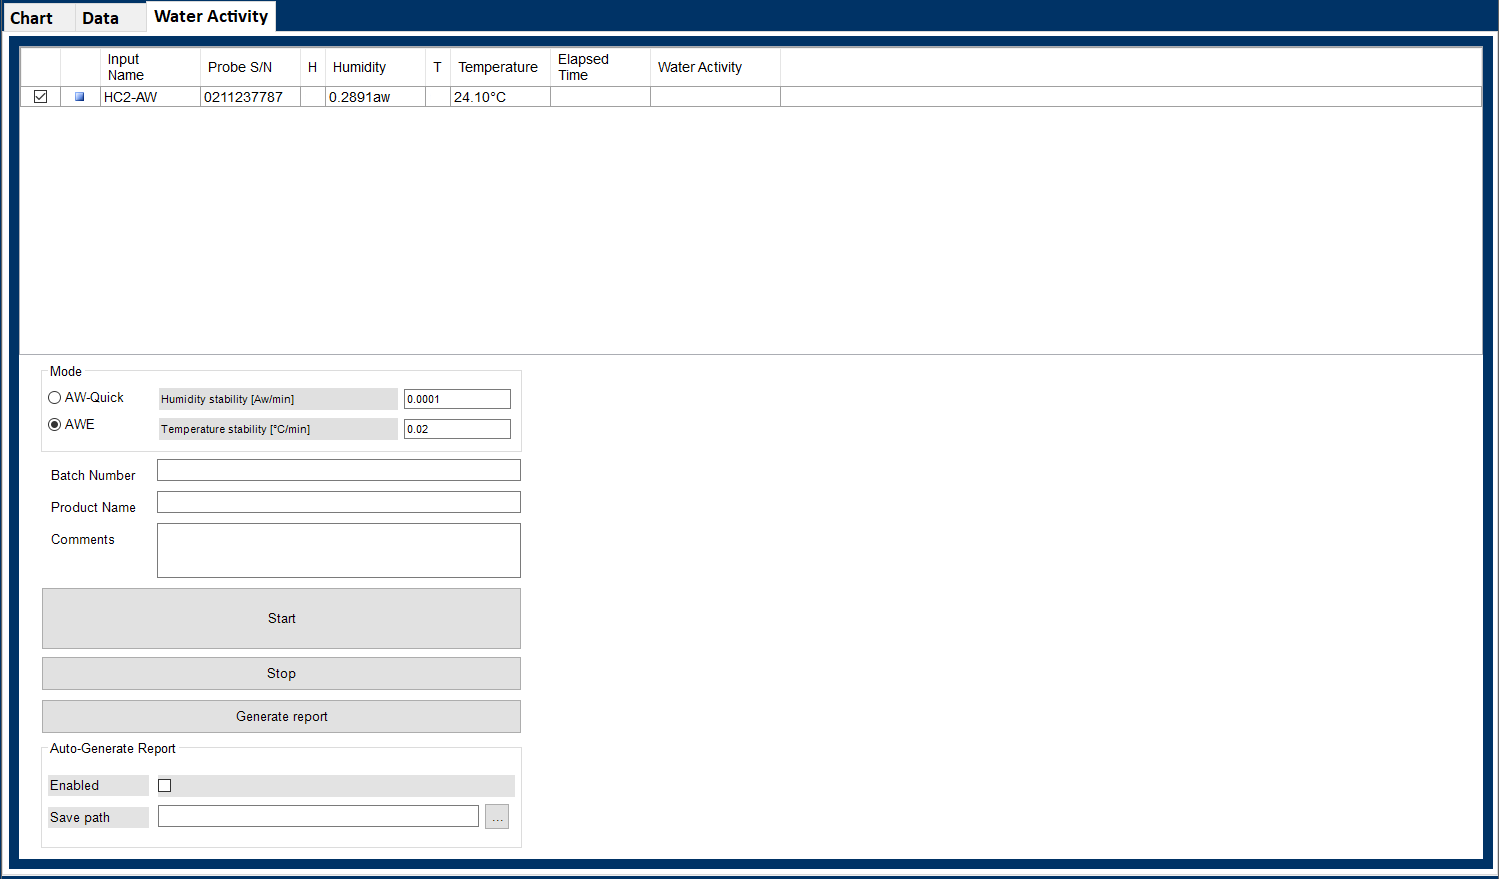
Water Activity
AW Measurement (AWE and AWQ) for AW probes as HC2-AW
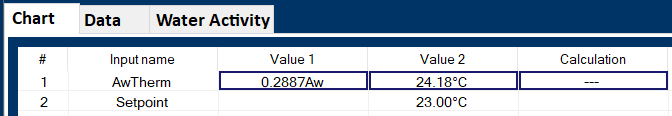
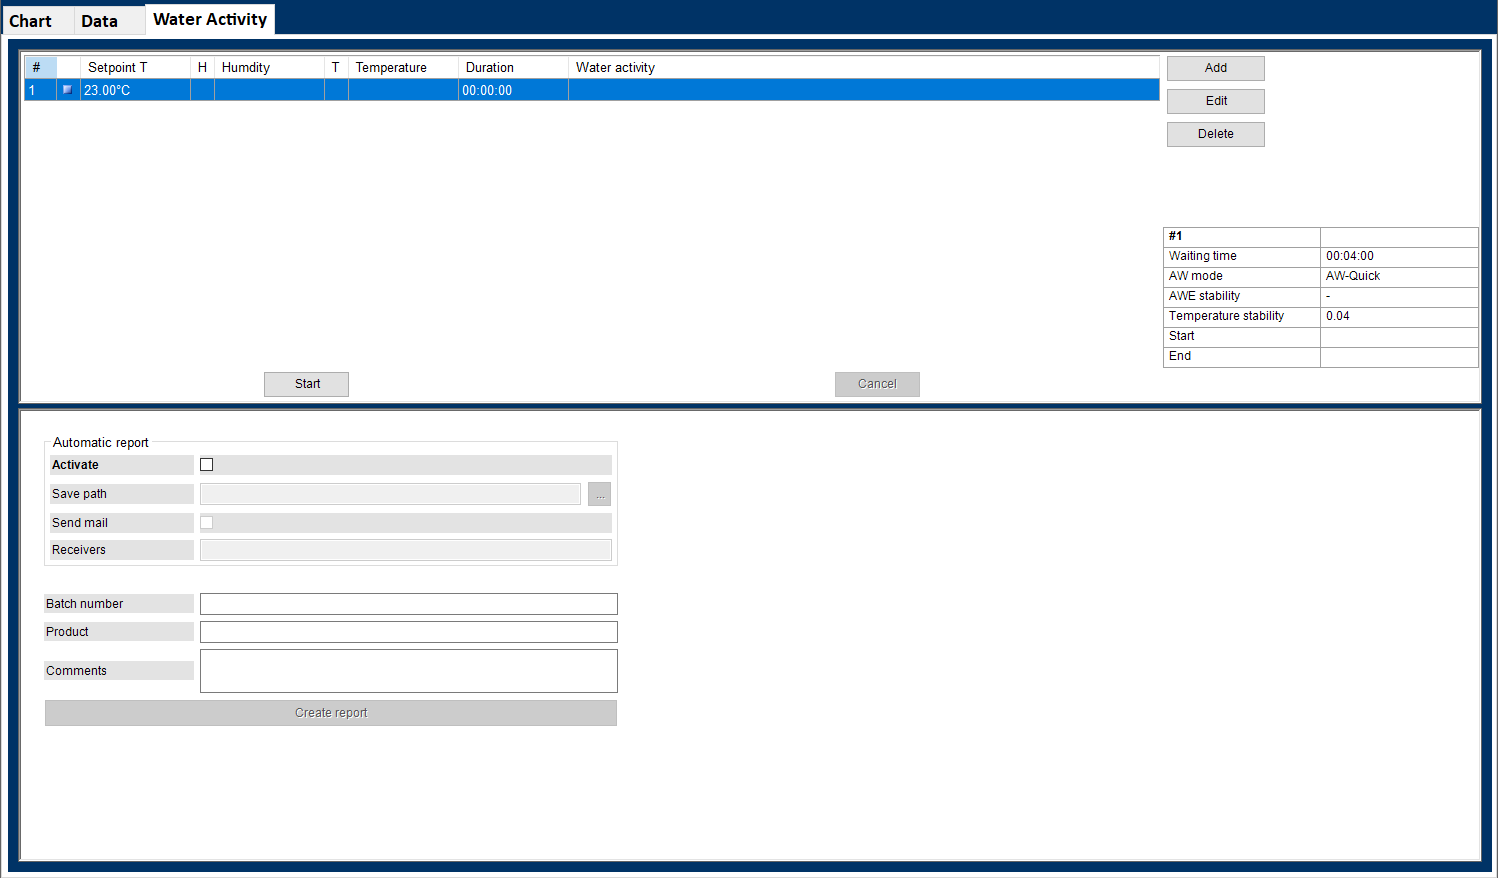
AW process for AW Therm
For the AW-Therm process, a different user interface is shown. Please see
At the chart tab, the running measurement (AW, temperature and setpoint) are displayed.