The table is a visualization tool.
The table also offers short cuts to inhibit measuring points and switch buttons and outputs.
Important feature: within the table, it is possible to see the last refresh time.
Print Screen 1 |
In the table view, the actual status of the measuring points can be visualized.
Under the Groups, it is possible to see the group structure and click either on one or more groups (SHIFT or CONTROL). All of the measuring points from the group will then appear. 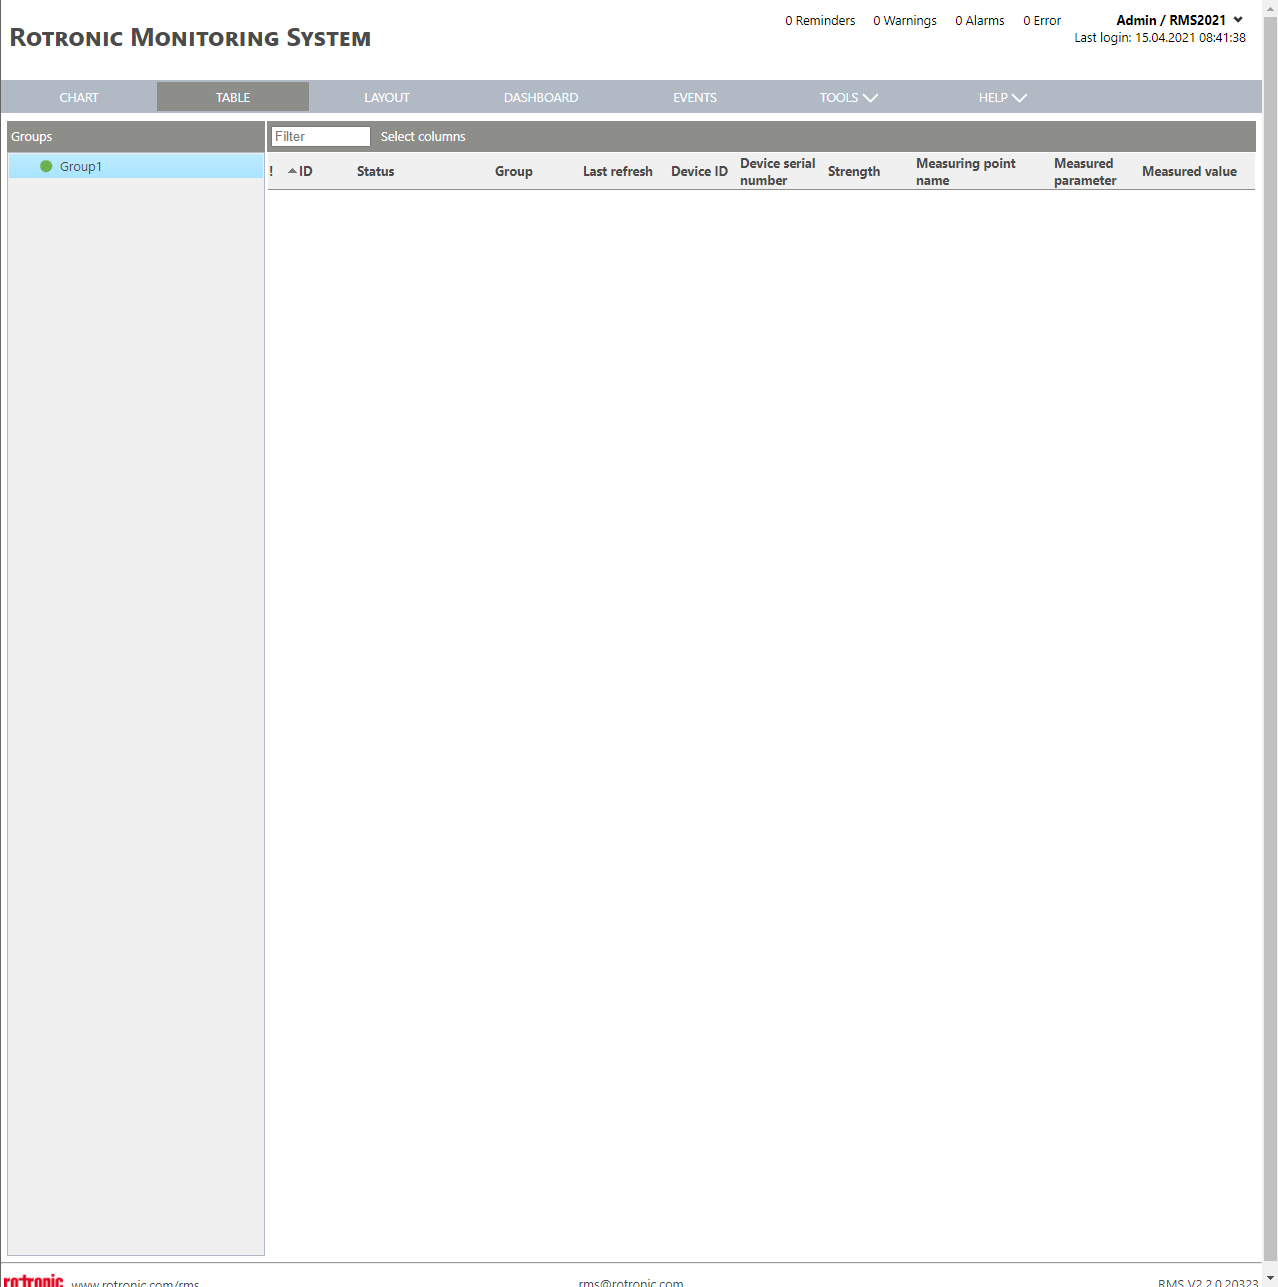 |
Print Screen 2 |
The columns from the print screen can be selected. 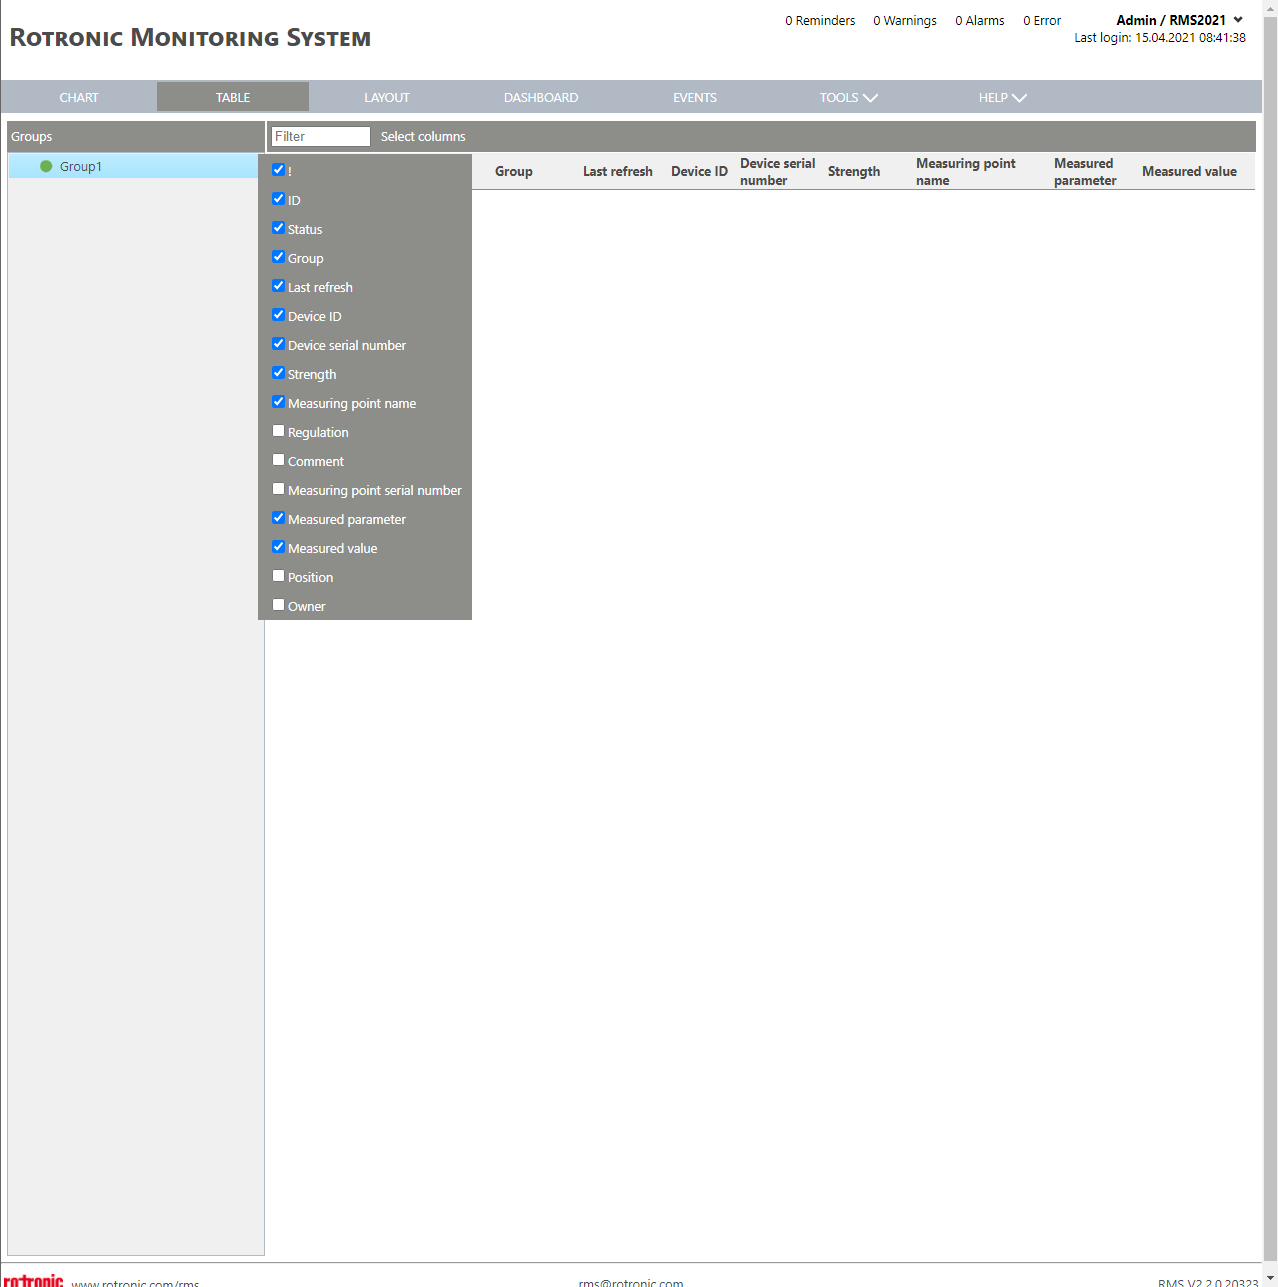 |