Measurement principal
The device carries out a temperature measurement at an adjustable interval for each connected PT100 sensor, stores the values and, if possible, forwards them to the server.
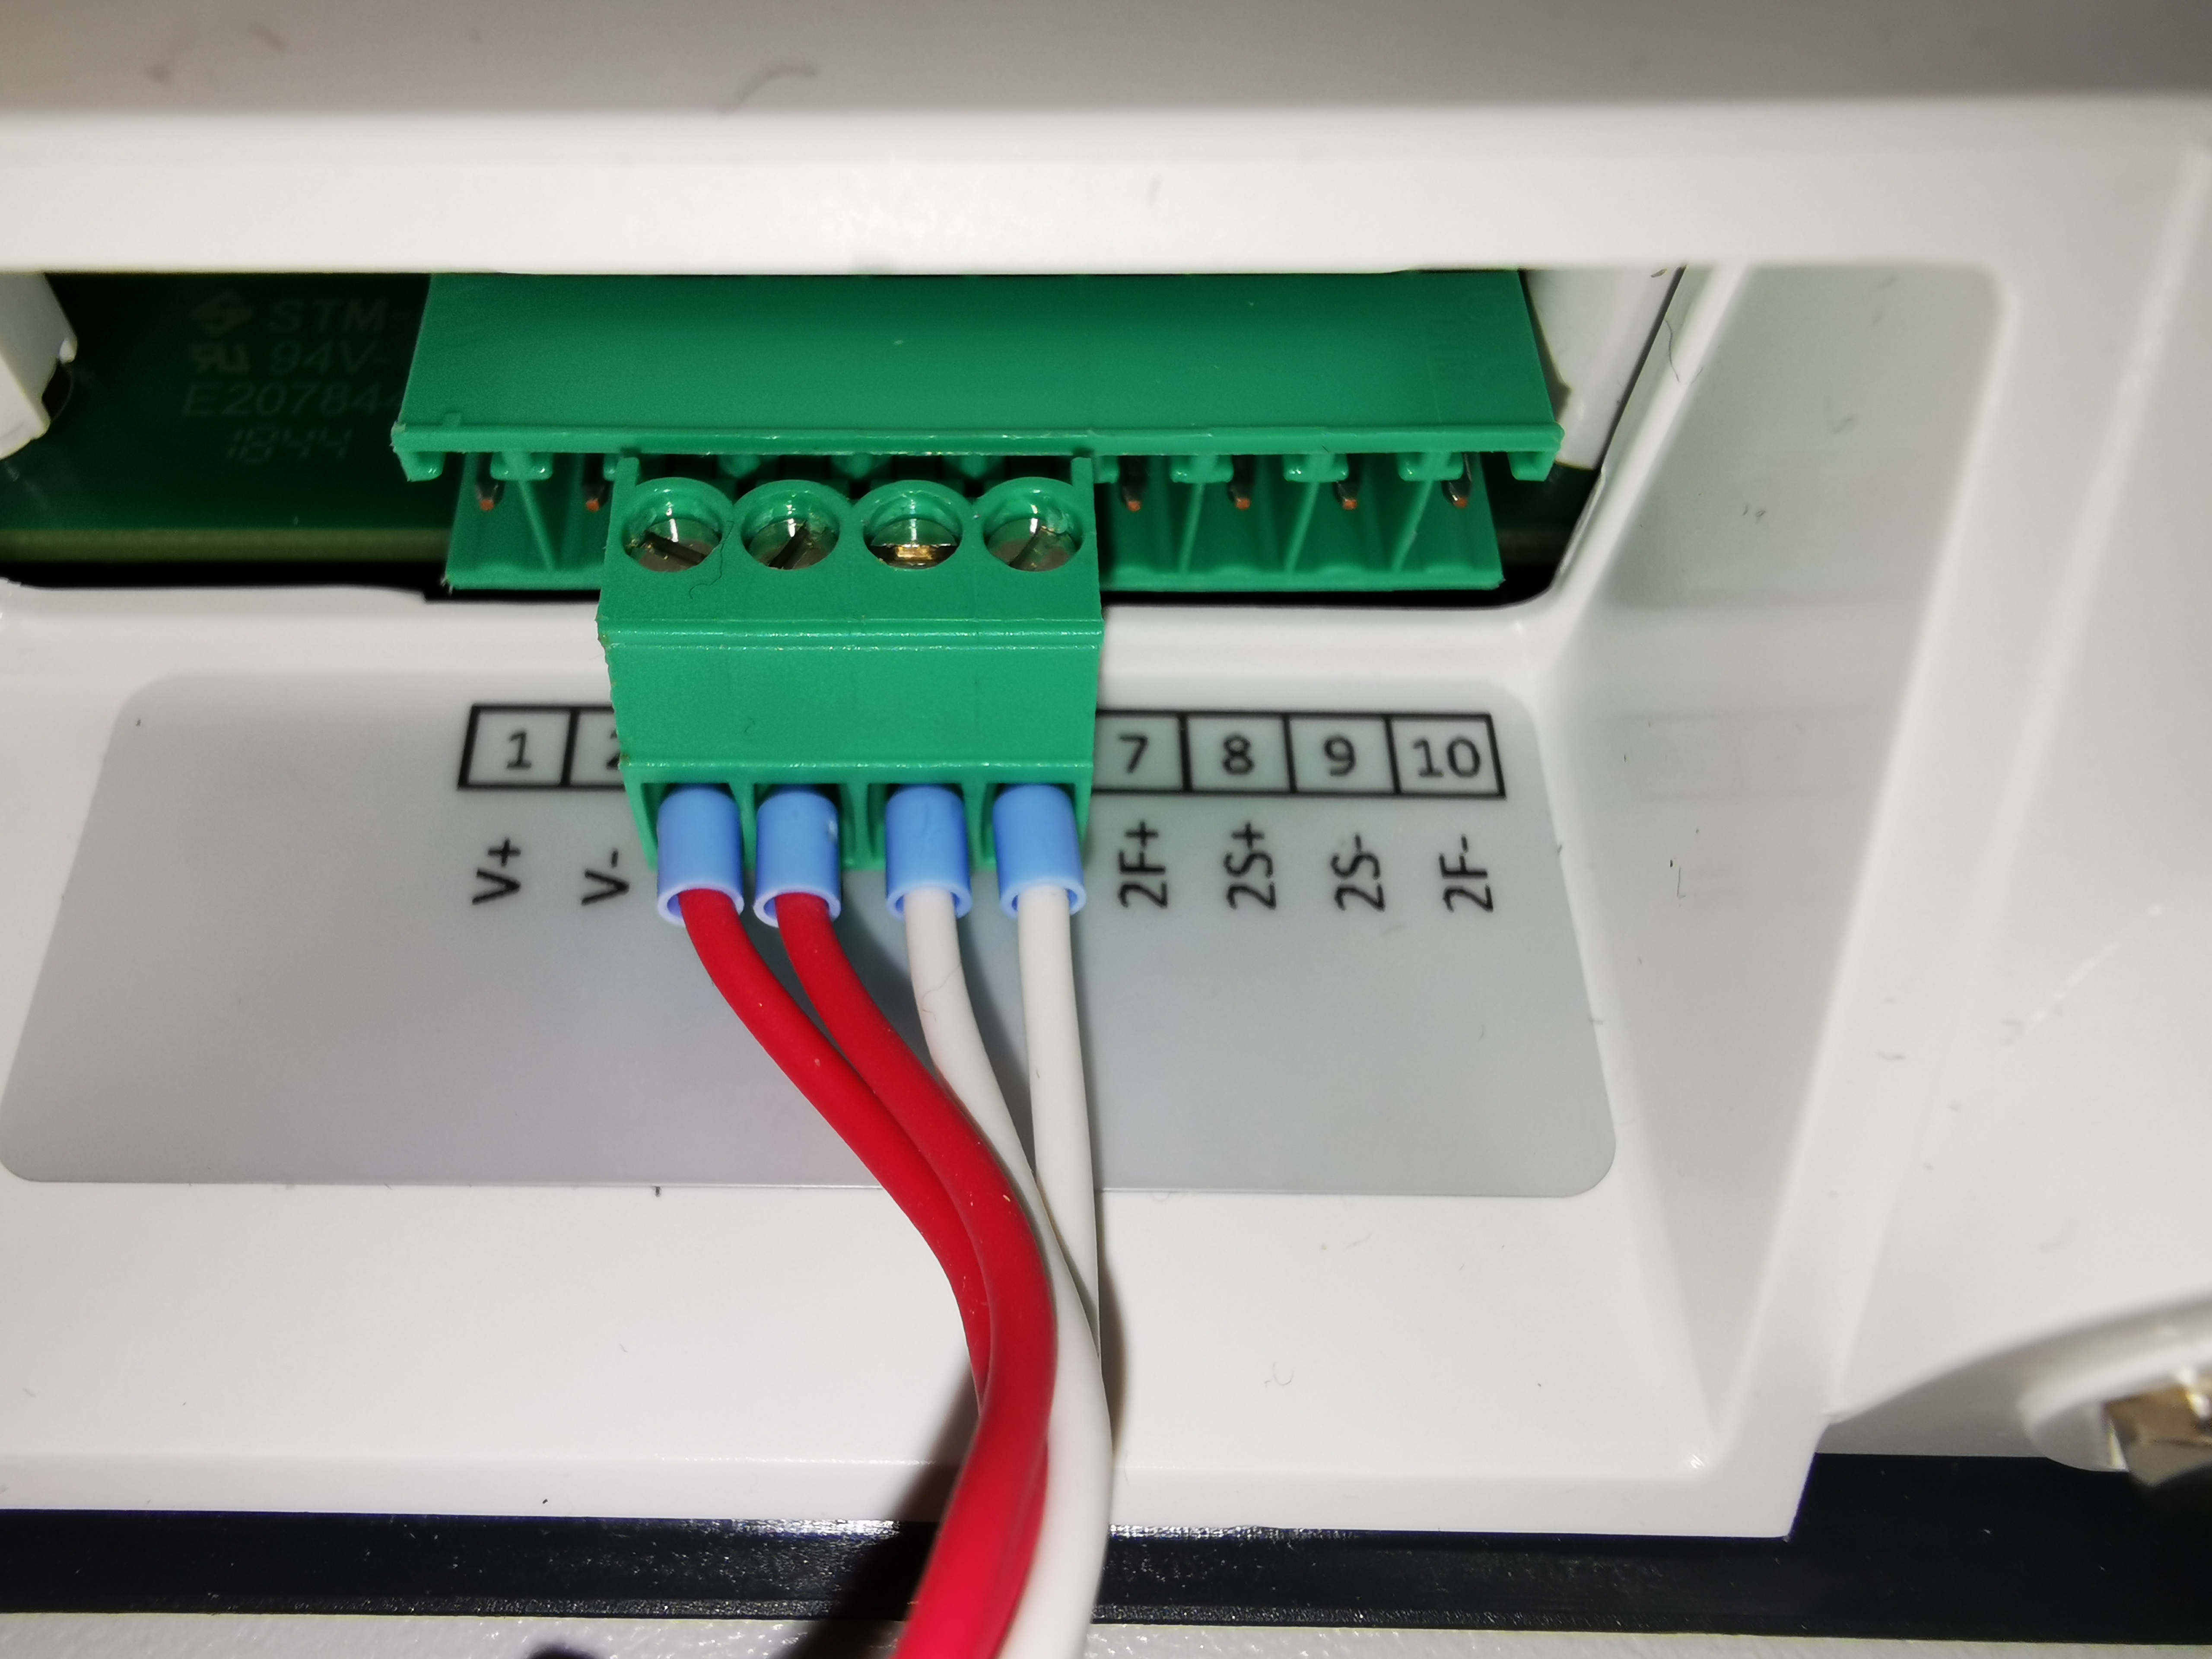
The device has two integrated analogue digital converters (ADC) for connecting two PT100 sensors. The PT100 can be connected to the ADC using 2-, 3- or 4-wire technology.
PT100 connections
Connection |
Description |
4-wire technology |
The 4-wire technology provides by far the most accurate measurement results, it completely eliminates the influence of the connecting cables on the measurement result, since any differences in the cable resistances of the connecting cable are also compensated 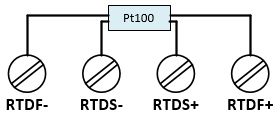 |
3-wire technology |
The influence of the line resistance is largely compensated with a 3-wire technology. The prerequisite for this, however, is that the line resistances are the same. 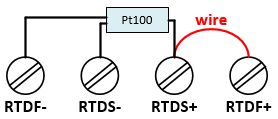 |
2-wire technology |
In 2-wire technology, the resistance of the supply lines to the sensor flows into the measurement as an error. The 2-wire technology therefore provides the most inaccurate measurement results of the 3 different connection techniques. 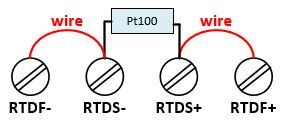 |
Number |
Marking |
Function |
|
|---|---|---|---|
1 |
V+ |
Power supply + |
 |
2 |
V- |
Power supply - |
|
3 |
1F+ |
RTD 1 Force+ |
|
4 |
1S+ |
RTD 1 Sensor+ |
|
5 |
1S- |
RTD 1 Sensor- |
|
6 |
1F- |
RTD 1 Force- |
|
7 |
2F+ |
RTD 2 Force+ |
|
8 |
2S+ |
RTD 2 Sensor+ |
|
9 |
2S- |
RTD 2 Sensor- |
|
10 |
2F- |
RTD 2 Force- |
Temperature calculation
The properties of a platinum resistance thermometer are defined in the IEC751 standard (Europe: EN60751). The current standard is EN60751+A2:1995 and is based on ITS90, the International Temperature Scale of 1990.
According to this standard, a platinum resistance is converted into the corresponding temperature using the following formulas.
Temperature range |
Formula |
|---|---|
-200 °C to 0 °C |
R(T) = R0 ( 1 + AT + BT2 + C( T – 100°C ) T3 ) |
0 °C to 850 °C |
R(T) = R0 ( 1 + AT + BT2 ) |
R(T) currently measured resistance at a temperature T |
|
R0 => PT100 nominal resistance and is 100 Ω at 0 °C (ITS90) |
|
Callendar van Dusen Coefficient
|
A = 3.9083 * 10-3 °C-1 |
B = -5.775 * 10-7 °C-2 |
|
C = -4.183 * 10-12 °C-3 |
With these formulas and the corresponding calculation tables between -200 °C and +850 °C, each temperature can be calculated or interpolated for the respective measured PT100 resistance.
Example for a PT100 table: https://www.omega.de/temperature/Z/pdf/z252-254-de.pdf
For highly accurate PT100 measurements, the Callendar van Dusen coefficients can be adapted to the respective PT100 sensor.
Characteristic curve
This is the characteristic curve of a Pt100 with a temperature coefficient of α = 3.851 x 10⁻³ °C-1:
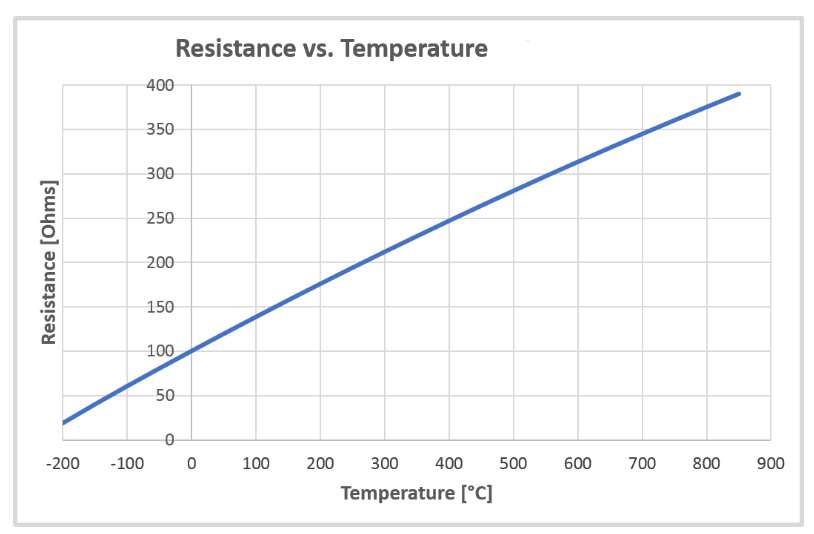
Conversion of the resistance value into a temperature value
With the formulas for temperature calculation described above, a table is calculated internally, which is used to convert the measured resistance value into the corresponding temperature. This table also takes into account the possible change in the Callendar van Dusen coefficients and is calculated for each change and each restart.
Description |
Calculation |
|---|---|
Temperature |
T(R) = Tlow + ((R - Ilow) * ((Thigh - Tlow) / (Ihigh - Ilow))) |
R = currently measured resistance value (factory adjusted) |
|
Ilow = next table value (index) lower than RMeas |
|
Ihighw = next table value (index) that is higher than RMeas |
|
Tlow = To Ilow related table value |
|
Thigh = To Ihigh related table value |
If the currently measured resistance is outside the table, the measurement is invalid.
Example of a resistance-temperature table:
Index Ω |
Temperature °C |
|---|---|
185.200800 |
-200.0 |
270.964328 |
-180.0 |
… |
... |
1000.000000 |
0.0 |
… |
... |
3831.286563 |
825.0 |
3904.811250 |
850.0 |
Pt100 Sensor Details
Temperature Pt100