With the report template, the user defines the content of report. As many templates can be generated as the maximum allowed measuring point in the system. The single elements can be selected/unselected.
oThere is no group structure for the report templates. All templates are visible for the whole company.
oRTP-0 is the system report template and cannot be edited.
oThere are three default templates for chart, table and event. These can be edited.
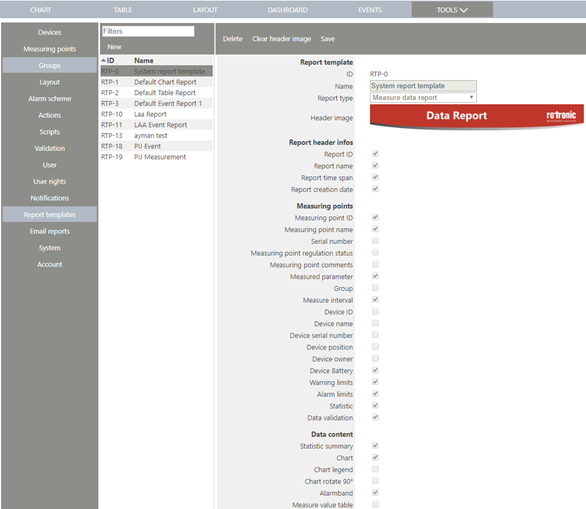
Figure 1: Elements to be selected/unselected by checking/unchecking the respective box
Report Template
ID |
Unique ID for the report template |
Name |
Name of the template |
Report type |
Measurement data or event report |
Header image |
By clicking the Logo, one can upload a picture as header image. (Maximum data size 512 kB) |
Report Header
Report ID |
Unique ID for the generated report (DOC-xx) |
Report name |
Report name |
Report time span |
Time window of measurement data |
Report creation date |
Creation date and time of the report |
Measuring point info (Info for each measuring point will be displayed in separate column)
Measuring point ID |
Unique ID for the measuring point (MPT-xx) |
Measuring point name |
Name of the measuring point |
Serial number |
Serial number of the measuring point |
Measuring point regulation status |
Regulation status of the measuring point |
Measuring point comments |
Comment of the measuring point |
Measured parameter |
Humidity, temperature, … |
Group |
Group of the measuring point |
Measure interval |
Interval of the measurement |
Device ID |
Unique ID for the device (DEV-xx) |
Device name |
Name of the device |
Device serial number |
Serial number of the device |
Device position |
Position of the device |
Device owner |
Owner of the device |
Device Battery |
Battery status of the device |
Warning limits |
Low and high limits for warning |
Alarm limits |
Low and high limits for alarm |
Statistic |
Number of measured values, min, max, average, standard deviation and MKT |
Data validation |
Validation result of data |
Data content
Statistic summary |
Summary of number of measured values, min, max, average and standard deviation for all measuring points |
Chart |
Chart for all measuring points. Always one chart for all measuring points in report |
Chart legend |
Legend with the MPT number of the measuring points |
Chart rotate 90° |
For big charts, possible to rotate by 90° |
Alarm band |
Alarm band will be displayed in chart, only when all measuring points have same alarm settings |
Measure value table |
Table with single measurement values. (With big amount of measured data the report generation takes a while) |
Alarms
Warnings summary |
Min/max value, min/max duration and total duration of all occurred warnings |
Warning details |
From/to time, duration, limit and min/max value for each warning separately |
Alarms summary |
Min/max value, min/max duration and total duration of all occurred alarms |
Alarms details |
From/to time, duration, limit and min/max value for each alarm separately |
Events
Messages |
Include "Messages" in report |
Reminders |
Include "Reminders" in report |
Warnings |
Include "Warnings" in report |
Alarms |
Include "Alarms" in report |
Error |
Include "Error" in report |
Finished events |
Include "Finished events" in report |
Acknowledged |
Include "Acknowledged events" in report |