Display of the current measured values graphically and numerically. All kinds of measuring points can be shown in "Chart" view:
oNormal measuring points
oAny psychrometric or arithmetic calculations
oVirtual buttons
oSystem measuring points
There are two buttons in the navigation bar. "Groups" and "Views".
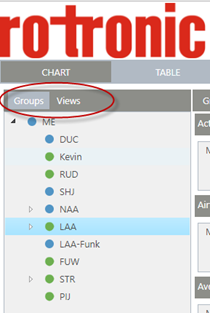
Figure 1: Navigation bar in "Chart" view
Groups view
By choosing "Groups" (see Figure 1), the tree of the system defined groups will be displayed. By selecting a group, all measure points pertaining to the group will be displayed. It is possible to select multiple groups. An example:
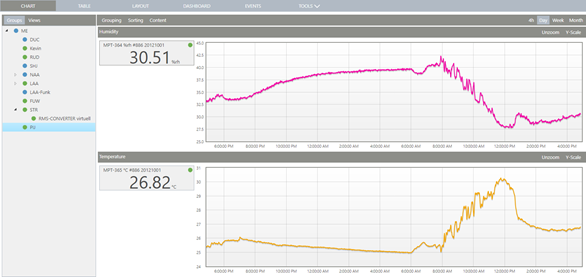
Figure 2: Graphic and numerical display of measured values in the "Groups" view
Main menu:
Grouping |
Automatic creation of Categories depending on: oMeasure point parameter oDisplay Category* oDevice of measure point oCommon chart for all measure points oSeparate chart for each measure point |
Sorting |
Sorting of the measure point panels (inside category) by: oMeasure point ID oName oSerial number oComment |
Content |
Displayed Information for a measure point inside panel: oMeasure point ID oName oSerial number oComment
Synchronize X-axis for all charts if one chart is zoomed |
Chart Range (right) |
Select time range for chart (all visible categories) |
Category Menu:
Unzoom |
Zoom back in the zoom history (if chart is zoomed) |
Y-Scale |
Select automatic or manual scale range for the Y-axis |
User defined view
By choosing "Views" (see Figure 1), the "User defined" views will be displayed. An example:
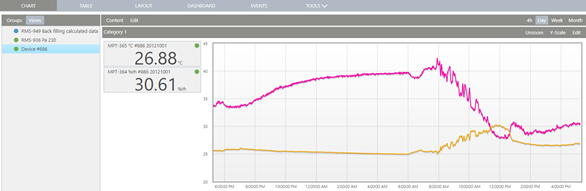
Figure 3: Graphic and numerical display of measured values in the "User defined" view
Main Menu
Content |
Displayed Information for a measure point inside a panel: oMeasure point ID oName oSerial number oComment |
Edit |
oAdd View Create a new (empty) User view oRename Rename the current user view oSave as Save a copy of the current user view oDelete Remove the current user view oAdd Category Adds a new Category at the bottom |
"Category Edit" Menu
Select Measure points |
Opens a dialog to select measuring points for the current category |
Rename |
Rename the current category |
Delete |
Delete the current category |
Move measure point panels
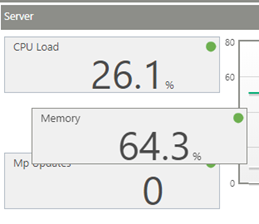
Figure 4: Drag and drop panels to reorder or remove measuring points
oPanels can be moved inside or to another category by drag and drop
oTo remove a panel, drag it over the chart and release the mouse button.